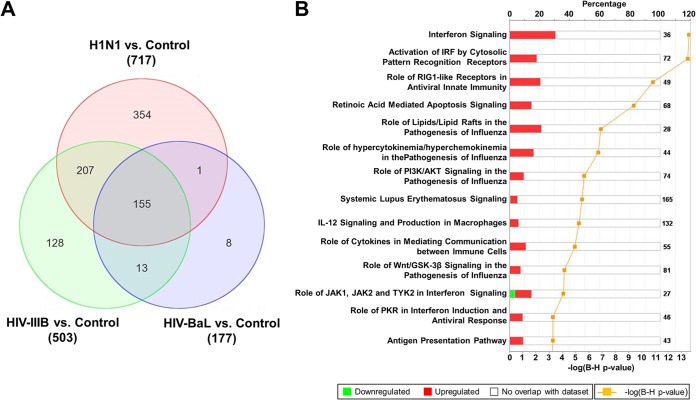
FIG 3.
Changes in gene expression and biologic pathways affected following infection with H1N1 influenza virus and HIV. pDCs were stimulated with influenza virus A/PR/8/34 (H1N1; Charles River Laboratories) at 4 HAU/ml, HIV-1 IIIB (Advanced Biotechnologies) at 1.00 ×10⁵ TCID50/ml, or HIV-1 BaL (Advanced Biotechnologies) at 1.00 ×10⁵ TCID50/ml. (A) Venn diagram displaying the numbers of differentially expressed genes in control versus virus-stimulated pDCs. The value next to each virus name is the total number of differentially expressed genes versus the uninfected control. (B) Top canonical biological pathways associated with the overlapping 155 differentially expressed genes in virus-stimulated samples. The stacked bar chart displays for each canonical pathway the number of genes found to be significantly upregulated (red) or downregulated (green) by Bayesian model selection. The molecules or genes in a given pathway that were not found on our list of significantly regulated genes are termed not overlapping with our data set (white). The value at the top of each bar represents the total number of genes or molecules in the canonical pathway. The Benjamini-Hochberg (B-H) method was used to adjust the right-tailed Fisher exact t test P values, which measure how significant each pathway is.

