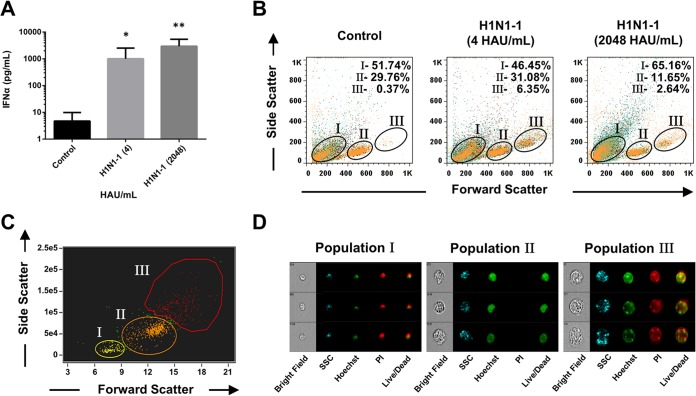
FIG 6.
pDC enlargement in response to treatment with low and high titers of H1N1 influenza virus. pDCs from three separate donors were stimulated with PBS (control) or influenza virus A/PR/8/34 (H1N1-1; Charles River Laboratories) at 4 or 2,048 HAU/ml. (A) Quantitation of IFN-α protein by ELISA of supernatants from pDCs treated with PBS (control) or (H1N1; Charles River Laboratories) at 4 or 2,048 HAU/ml. (B) Flow cytometry side scatter versus forward scatter plot of pDCs treated with PBS (control) or (H1N1; Charles River Laboratories) at 4 or 2,048 HAU/ml. (C) Representative side scatter versus forward scatter plot of pDCs with an ImageStreamX imaging flow cytometer following H1N1 influenza virus stimulation. (D) Representative images of cell viability analysis of pDCs with an ImageStreamX imaging flow cytometer following H1N1 influenza virus stimulation. All nucleated cells were labeled with Hoechst 33342 (green). Dead cells were colabeled with both Hoechst 33342 and PI (red). Live cells were identified as PI negative. *, P < 0.05; **, P < 0.01 (determined by ratio paired t test compared with the corresponding control). SSC, side scatter.

