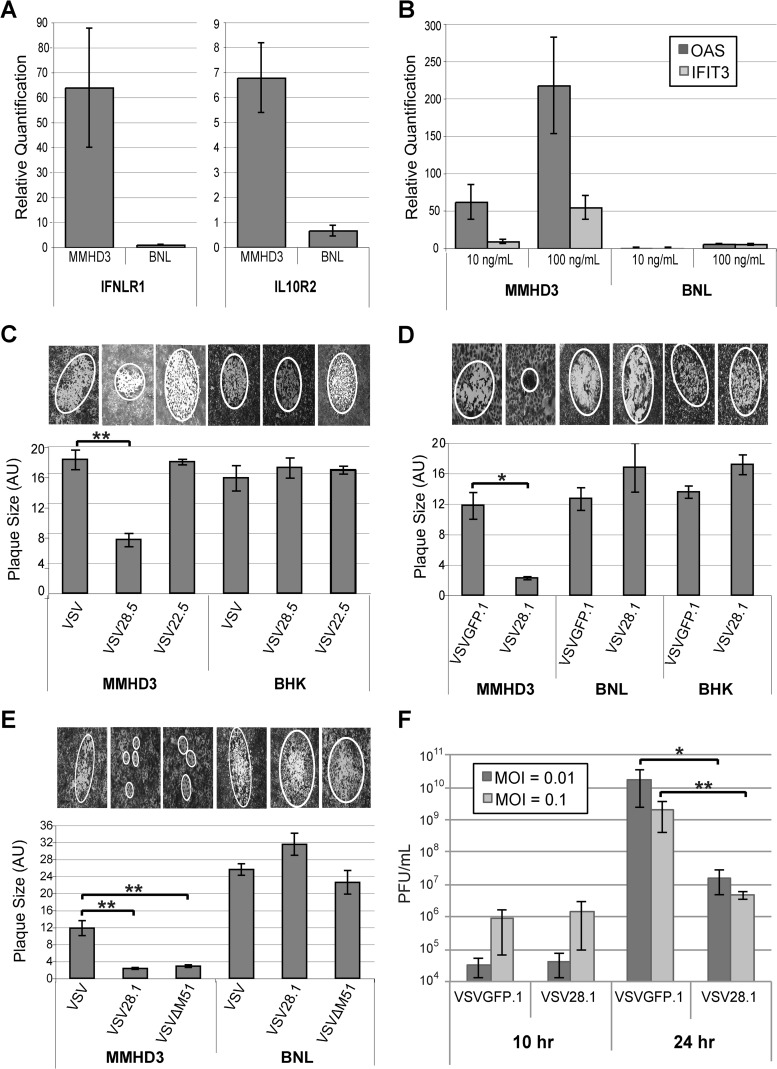
FIG 2.
VSV expressing IFN-λ is attenuated in IFN-λ-responsive cells. (A) Total RNA was prepared from MMHD3 or BNL cells, and IL-10Rβ and IFN-λR1 mRNA was quantified by quantitative RT-PCR. (B) MMHD3 or BNL cells were treated with or without 10 ng/ml or 100 ng/ml IFN-λ for 24 h and harvested for total RNA isolation. ISGs OAS and IFIT3 were quantified by quantitative RT-PCR. (C to E) MMHD3, BNL, or BHK cells were infected with serially diluted virus, and at 2 days p.i., plaques were stained and then visualized and photographed under a light microscope for quantification of the average relative plaque size by measuring the area of an ellipse that was fitted to the plaque. The bar graphs depict the mean individual plaque areas, with error bars representing the standard errors of the means. Representative images of plaques are shown above each graph. (F) MMHD3 cells were infected with VSVGFP.1 or VSV28.1 at MOIs of 0.01 and 0.1, and media were collected at 10 and 24 h p.i. to quantify viral production by a standard plaque assay. *, P < 0.05; **, P < 0.01.

