FIG 2.
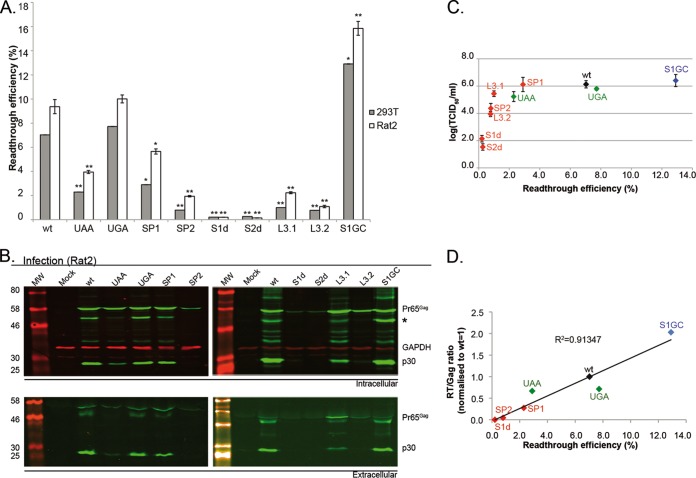
Readthrough efficiencies and virus replication analysis of first-generation readthrough signal mutants. (A) MuLV readthrough efficiencies in 293T and Rat2 cells. Cells were transfected with pDluc-MuLV or a first-generation mutant derivative (Fig. 1B), and 24 h later, lysates were prepared and assayed for Renilla and firefly luciferase. Data represent mean values from at least eight samples over three independent experiments. Error bars represent standard errors of the means (SE). Samples were subjected to two-tailed t tests if they corresponded to a normal distribution or to Mann Whitney U tests if not. *, P < 0.01; **, P < 0.001, compared to the WT. (B) 293T cells were transfected with pNCA or a first-generation mutant derivative, and released virus was used subsequently to infect Rat2 cells. Cell lysates (upper panel) and supernatant virus (lower panel) from Rat2-infected cells were analyzed by 10% SDS-PAGE and immunoblotting using a polyclonal anti-CA (p30) serum. Molecular weights (MW; in thousands) are indicated on the left. GAPDH was used as a loading control. All viral proteins were detected with a green fluorescent secondary antibody, and GAPDH was detected with a red fluorescent secondary antibody. An asterisk indicates a Pr65Gag processing intermediate with a slightly raised intracellular level. (C) TCID50 assays were performed with serial dilutions of 293T-transfected cells as described in Materials and Methods. Samples were harvested at 96 hpi and stained for Gag, and plates were imaged and scored for the presence of fluorescent signal. TCID50 titers were calculated according to Reed and Muench (35) and are represented as log-transformed values for clarity. Values represent the mean of duplicate titrations from two independent experiments, each internally normalized to the WT titer. Error bars represent standard errors. (D) Gag-Pol/Gag ratios in supernatant viruses from 293T-transfected cells (72 hpt) was estimated as the ratio of reverse transcriptase activity (RT) to Gag protein concentration, as judged by dot blot quantification. RT assay data are the mean of triplicate values, and dot blot numbers are the mean of two independent experiments in duplicate. The WT ratio was set to 1, and other samples were normalized to the WT. Only representative mutants were selected.

