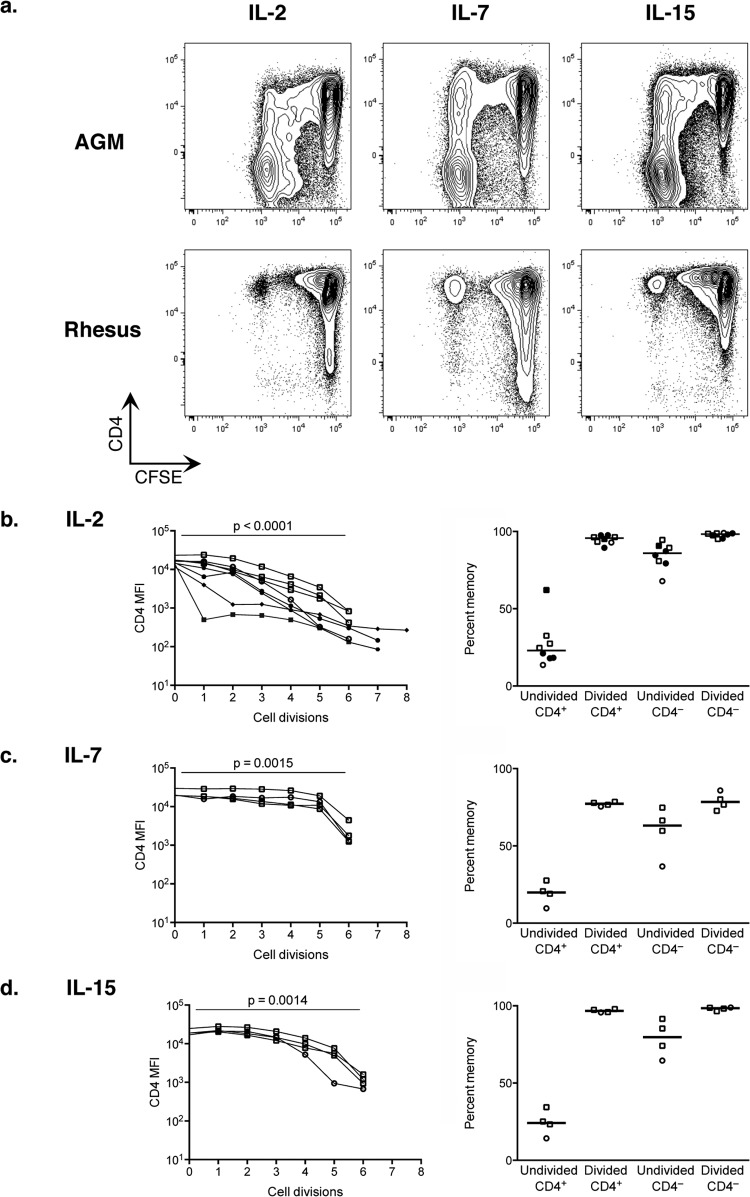
FIG 5.
CD4 downregulation induced by homeostatic cytokines. AGM and rhesus macaque PBMC were CFSE labeled and sorted for CD4+ CD3+ T cells and CD3− NKG2A− HLA-DR+ antigen-presenting cells. These were cultured with IL-2 for 6 days or IL-7 or IL-15 for 7 days and analyzed by flow cytometry. (a) Plots gated on live CD3+ T cells showing CD4 (y axis) and CFSE (x axis). (b to d, left) Median fluorescence intensity of CD4 plotted for AGM cells that have divided the indicated number of times based on CFSE dilution. MFI of CD4 in undivided cells (zero divisions) compared to cells that had divided six times using a paired t test. (b to d, right) Percentage of AGM T cells in each population that expressed a memory phenotype by CD28 and CD95 staining. Undivided CD4+ T cells were compared to each of the other populations by paired t test (P < 0.004 in all cases). Adult animals are denoted by squares, juvenile animals by circles, SIV+ animals by filled symbols, and SIV− animals by open symbols. Median values for each population are shown.

