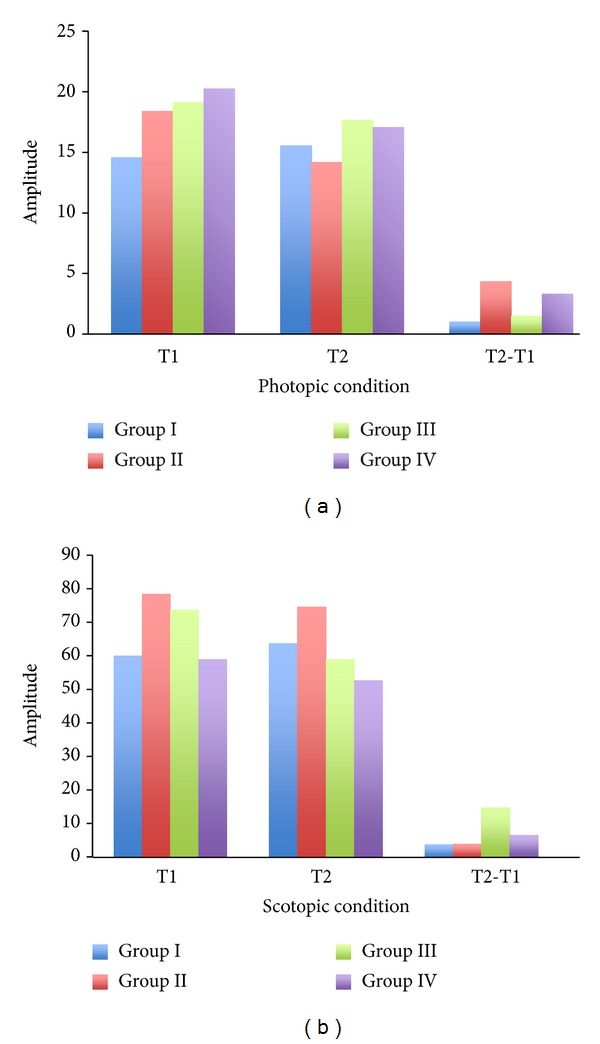
Figure 2.

The electroretinogram (ERG) was performed on the control (Group I), diabetes (Group II), and diabetes + taurine (Group III, Group IV) groups on week 5 (T1) and week 15 (T2). The averaged a-wave amplitude under the photopic (a) and scotopic (b) conditions was recorded and analyzed.
