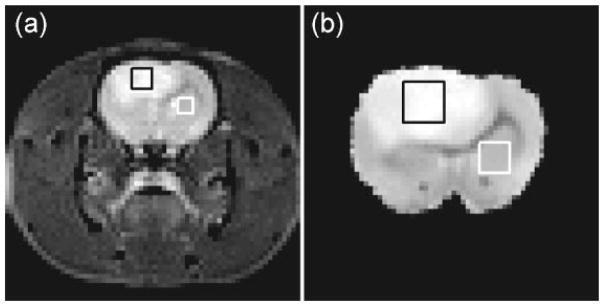
Figure 1.

(a) Representative T2-weighted images acquired in vivo (TE = 40 ms) along with representative ROIs for tumor (black box) and normal (contralateral subcortical grey matter, white box) tissue. (b) Corresponding ex vivo image (TE = 30 ms) from the same animal (Rat #10).
