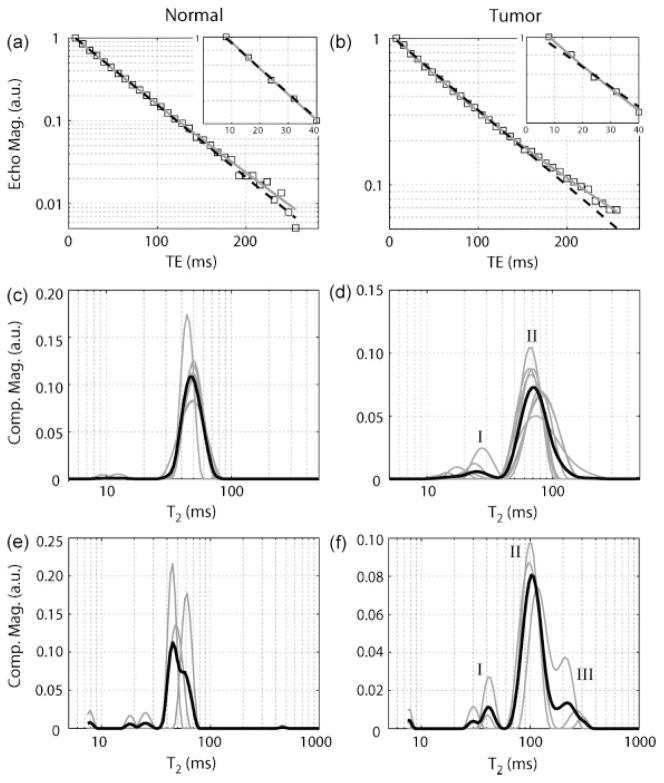
Figure 3.
(a and b) Sample decay curves from normal and tumor tissue ROIs in vivo. Data were fitted using multiexponential (grey solid line; Eq. [2] with J=100) and monoexponential (black dashed line; Eq. [2] with J=1 and μ=0) models. Note that tumor signal deviates from the monoexponential model fit, especially at shorter echo times as shown in the zoomed insets. (c and d) T2 spectra from in vivo measurements for individual animals (gray) as well as the mean spectrum across animals (black). Two components (I and II) were observed in tumor signal in eight of the eleven rats in vivo (only spectra from these eight rats are given here), while signal from normal tissue was consistently monoexponential. (e and f) T2 spectra from ex vivo measurements. Three components (I, II, and III) were in observed in tumor signal in all three rats. Once again, normal tissue was consistently monoexponential. Note, the small peaks to the far left of these spectra were deemed artifacts of the fitting process and were ignored in subsequent analysis. Component values for each rat are listed in Tables 2 and 3 for in vivo and ex vivo measurements, respectively.

