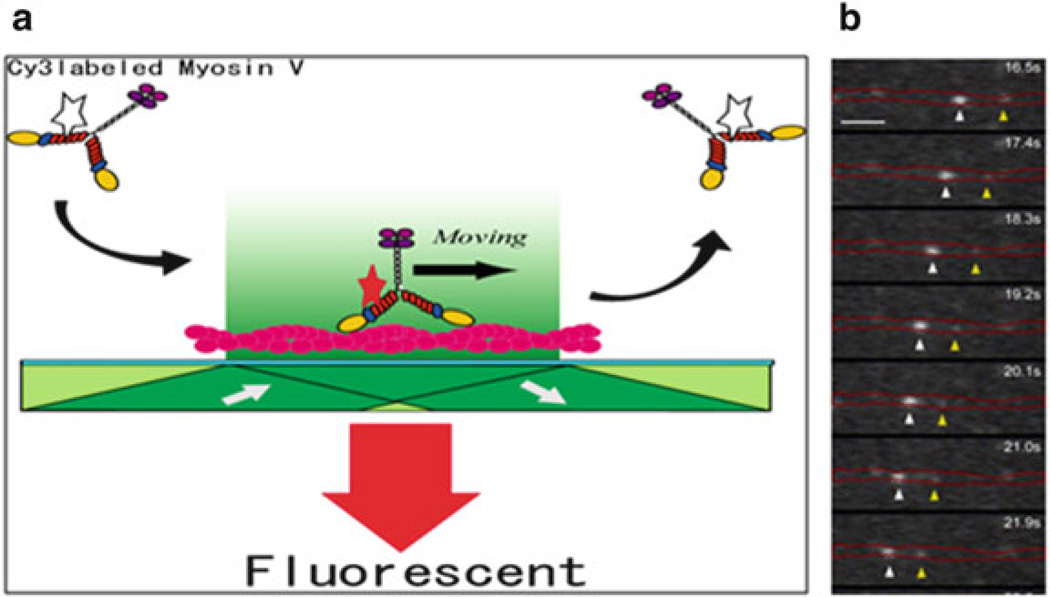
Fig. 9.2.
Single-molecule in vitro motility assay. (a) Diagram of the geometry of the assay using myosin 5a. The star on myosin 5a represents a fluorophore bound to a calmodulin light chain. When it is in the evanescent field, it is depicted in red showing that the fluorophore is excited. The dark green shading shows the direction of the laser excitation. The actin filament bound to the surface is colored red. (b) The position of a moving fluorophore along actin as a function of time (top to bottom). In this case, the fluorophore is GFP-Rab27a which is bound to the motor, myosin 5a, via melanophilin. The image is taken from Wu et al. [63]. The position of the stationary actin filament is marked by red lines, and the positions of two moving spots are marked with arrow-heads. The scale bar is 3.2 µm

