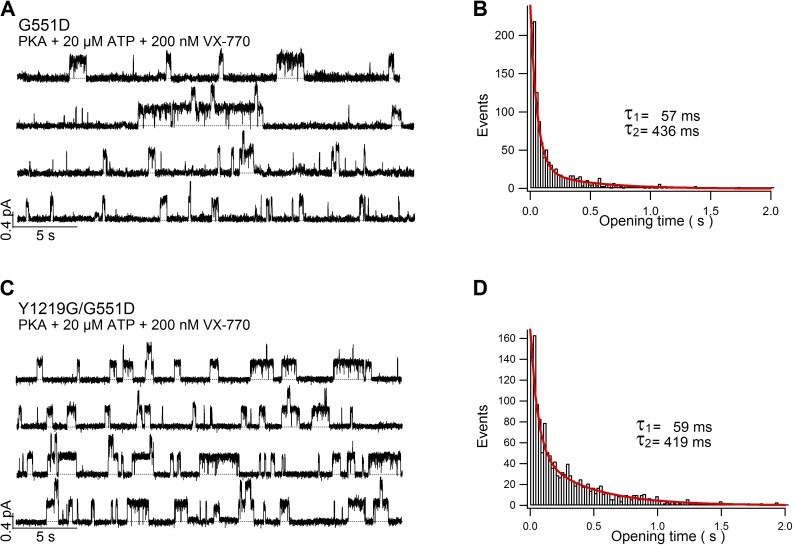
Figure 7.
Two populations of opening events differentiated by distinct open time. (A) Single-channel recording of G551D-CFTR in the presence of 20 µM ATP. (B) Open time histogram for G551D-CFTR. A total of 1,665 events collected from four different patches were analyzed. The red line marks curve fit using a double exponential function. (C) Single-channel recording of G551D/Y1219G-CFTR in the presence of 20 µM ATP. (D) Open time histogram for G551D/Y1219G-CFTR. A total of 1,502 events collected from four separate patches were analyzed. The red line marks curve fit using a double exponential function.

