
Extended Data Figure 2. Assembly of a genome wide DNA methylation time series through human early development and over ESC derivation.
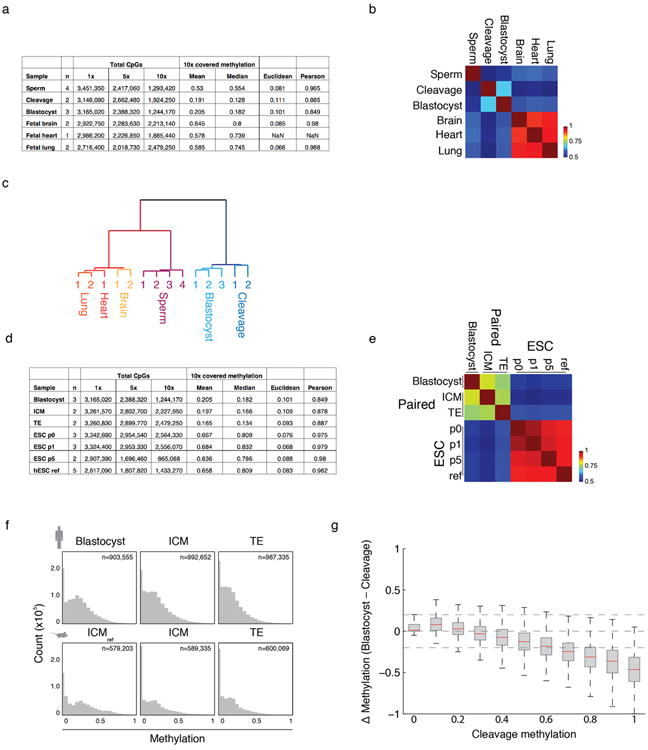
a. Summary of RRBS libraries generated, with number of biological replicates (n), number CpGs captured at 1×, 5×, and 10×, mean/median methylation values for 100 bp tiles estimated from CpGs covered at ≥5×, and mean Euclidean distance and Pearson correlation across biological replicates for these tiles.
b. Pearson correlation matrix for sperm, early embryonic, and fetal tissue samples.
c. Clustering of gametic, somatic, and preimplantation methylation profiles segregate according to their global DNA methylation landscape, with Sperm/Somatic tissue forming an adult methylation cluster that contrasts the unique epigenetic landscape present in preimplantation embryos.
d. Summary of RRBS libraries generated for ESC derivation, with number of biological replicates (n), number CpGs captured at 1×, 5×, and 10×, mean/median methylation values for 100 bp tiles estimated from CpGs covered at ≥5×, and mean Euclidean distance and Pearson correlation across biological replicates for these tiles. hESC ref refers to a reference collection of previously assayed ESC lines as part of the NIH Roadmap Epigenomics Project (Methods). Human ICM/TE were isolated through laser-assisted microdissection.
e. Pearson correlation matrix for human samples used to model ESC derivation. A consistent signature is rapidly acquired by the outgrowth stage (p0) and stably maintained over additional passages.
f. Methylation histograms for 100 bp tiles for human blastocysts and dissected ICM/TE tissue show minimal global difference, which is also observed when comparing previously assayed, immunosurgically purified mouse ICM to mechanically dissected ICM and TE.
g. Boxplots of the change in methylation (Δ methylation) for 100 bp tiles from cleavage to the blastocyst stage show passive demethylation of DNA methylation, particularly for regions that exhibit the highest methylation levels at this stage. Red line signifies the median, boxes and whiskers the 25th/75th and 2.5th/97.5th percentiles, respectively.