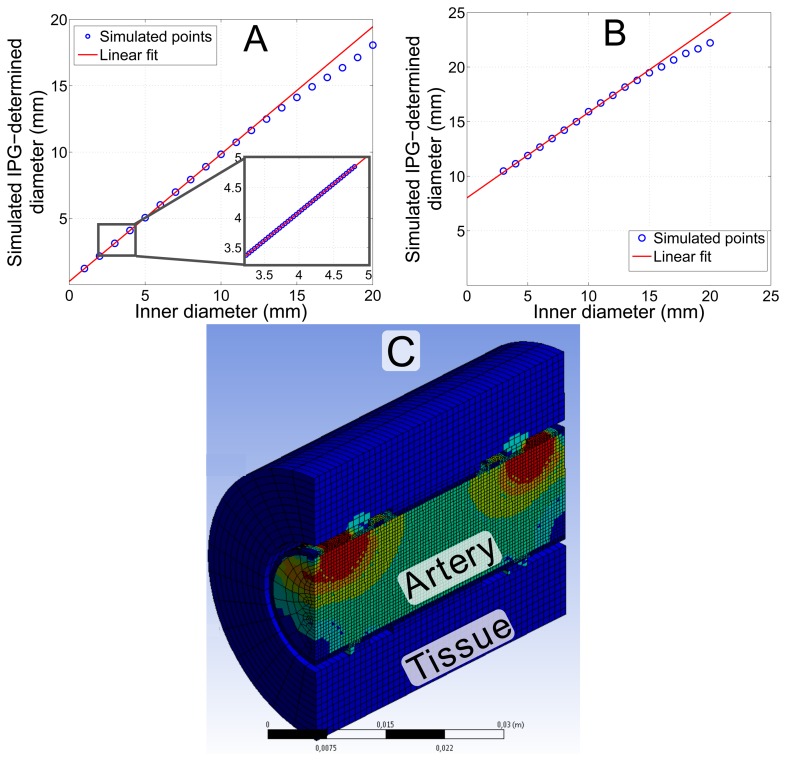
Figure 5.
Simulation of the diameter, determined by IPG measurements using the FEM model shown in Figure 4. (A) Simulation of an extended range of the arterial diameter for an ex vivo artery. The inset magnifies the physiologically most relevant part with a correlation of r = 1.0. The slope of the linear fit is m = 0.96 and the offset c = 0.25 mm. (B) Simulation considering in vivo conditions with 20 mm of tissue around the artery. The slope of the linear fit is m = 0.78 and the offset c = 8 mm; correlation coefficient r = 0.9997. (C) The model considering in vivo conditions with additional layers of tissue.

