
Figure 2.
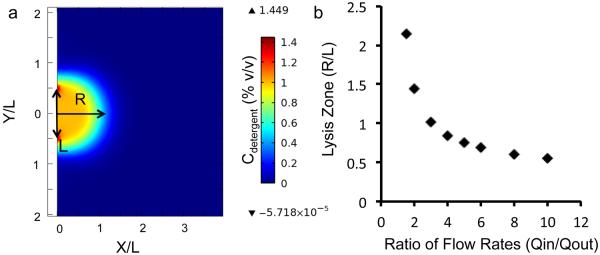
Simulation of tunable lysis zone.
(a) Plot of detergent concentration on a flat surface near the tip of the microfluidic probe, obtained from COMSOL® Multiphysics simulation of fluid flow and species transport equations. The formation of a lysis zone with a high detergent concentration (1% v/v) is evident, as well as the fact that the detergent remains confined to this zone and the rest of the surface sees no detergent at all. (b) Variation of the lysis zone radius (R) with the ratio of lysis buffer out-flow rate (Qout) to the lysate in-flow rate (Qin) – measured as the distance from the tip at which the detergent concentration falls to 0.1% – normalized to the characteristic length scale of the tip (chosen as L = w + 2p, where w is the width of the channel, and p is the separation between channels). (For the simulation in (a), w = 100 μm, p = 50 μm.)