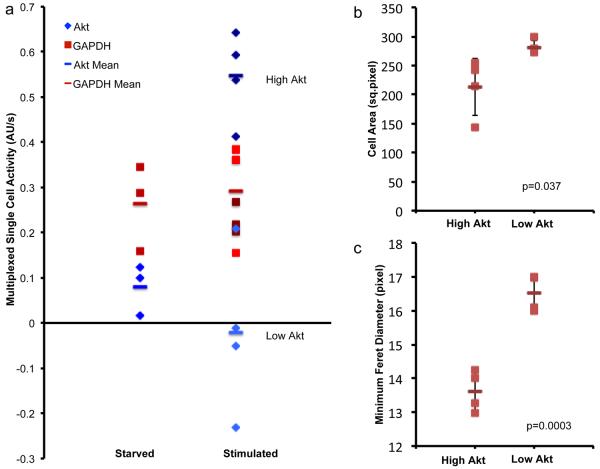
Figure 5.
Multiplex single-cell enzyme activity measurements.
(a) Measurements of Akt (blue) and GAPDH (red) activity simultaneously from single cells. For “high Akt” cells, Akt activity (dark blue) increases upon stimulation with insulin for 16.5 minutes (p value of 3.2×10⁻⁴), whereas GAPDH activity (dark red) is unaffected (p value of 0.98). For “low Akt” cells, neither Akt (light blue) or GAPDH (light red) activities are affected by insulin stimulation (p values of 0.35 and 0.50, respectively). The negative values indicate that these measured slopes were lower than the lysis buffer control value, which reflects an increased contribution from photobleaching. (b–c) Statistically significant differences are seen between “high Akt” and “low Akt” cells in the morphological parameters of (b) cell area and (c) minimum Feret diameter (or caliper width) (p values for Student's t tests as shown). Error bars represent s.d.

