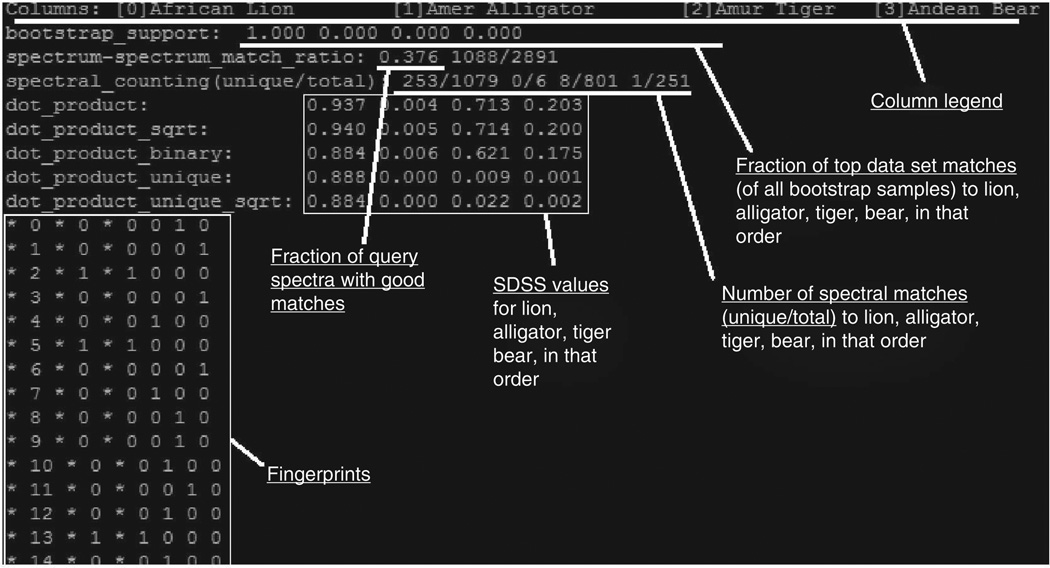
Figure 3.
A snapshot illustrating the anticipated fingerprinting summary file. The first line is the column legend that lists the animal sources (as specified in <ANIMAL_NAME> in Step 16) and their column indices in square brackets. The second line is the fractions of the top-scoring match that are in the order of animals specified in the first line. The third line is the match ratio, showing the fraction of good matches among all MS/MS spectra in the query files and the actual number of spectral matches versus the number of query spectra. The fourth line is the ratio of the number of spectral matches to library spectra unique to a species versus the total number of spectral matches to library spectra that have contributing replicates from that species, and it is in the same order as listed on the first line. The next five lines are the different SDSS values. After the SDSS scores, the actual spectral fingerprint is shown as a table. See the text for details.

