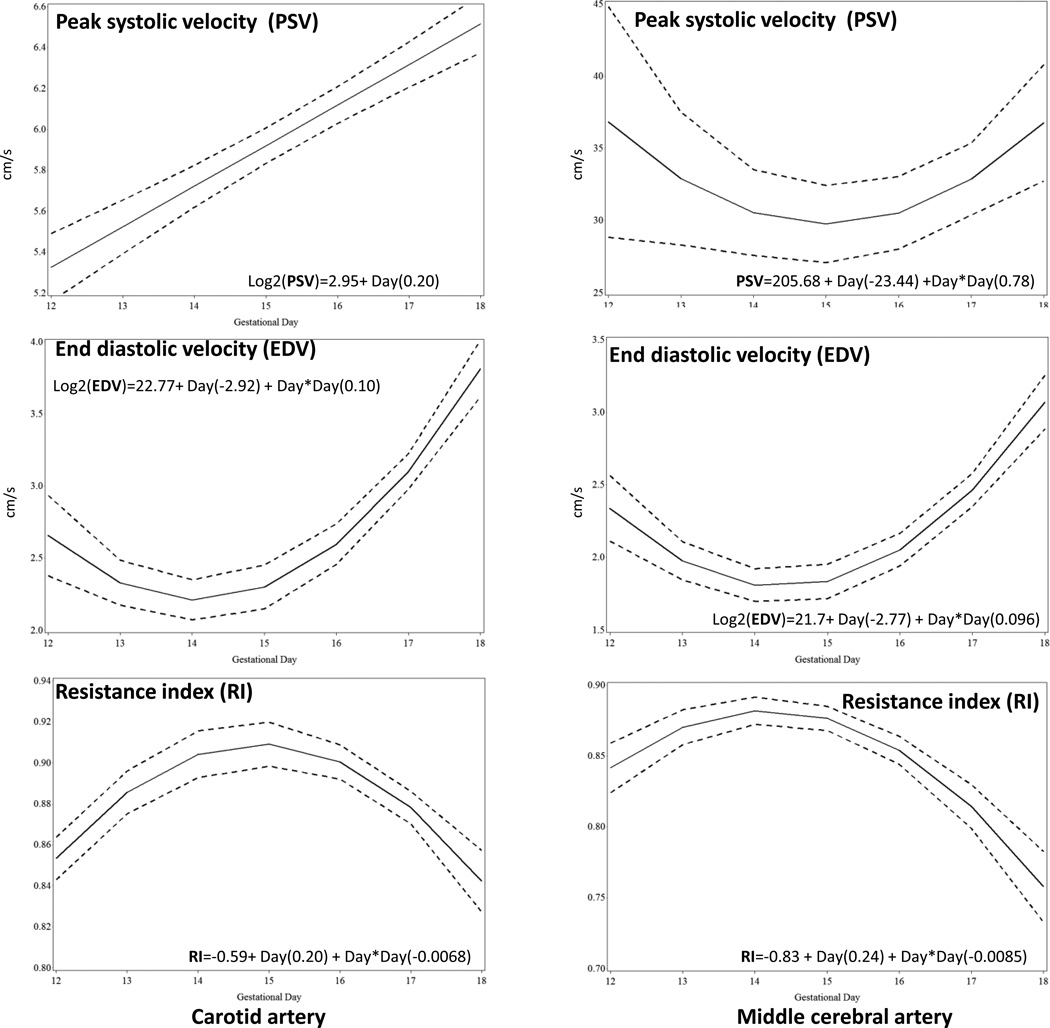
Figure 6.
Doppler velocities and resistance index (RI) from gestational day 12 to gestational day 18 of the common carotid artery PSV, peak systolic velocity (1a); EDV, end diastolic velocity (1b); RI, resistance index (1c) and middle cerebral artery PSV, peak systolic velocity (2a); EDV, end diastolic velocity (2b); RI, resistance index (2c). The solid line represents the best fitting mean determined using a generalized linear model, whereas dashed lines represent the 95% confidence limits of the mean.

