
Table 2.
Changes in VA and CMT between baseline and the final FU visit (14 eyes from 12 patients)
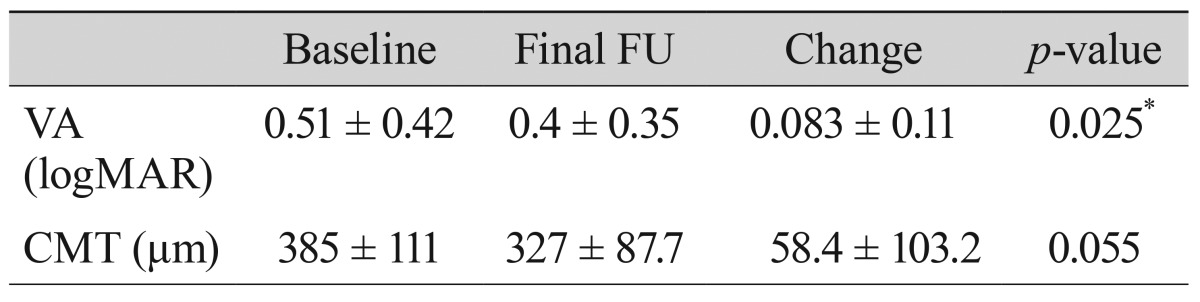
Values are presented as mean ± SD.
VA = visual acuity; CMT = central macular thickness; FU = follow-up; logMAR = logarithm of the minimum angle of resolution.
*p < 0.050.