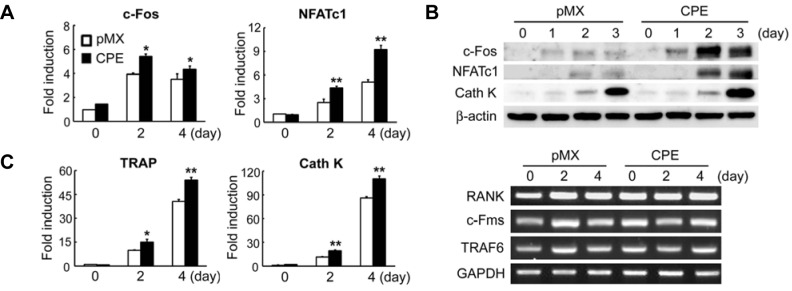
Fig. 3.

Overexpression of CPE increases the expression of c-Fos and NFATc1. BMMs were transduced with pMX control or CPE retrovirus and cultured with M-CSF (10 ng/ml) and RANKL (20 ng/ml) for the indicated number of days. Real-time PCR (A), immunoblotting (B), or RT-PCR (C) was performed to assess the expression of the indicated genes. GAPDH and β-actin served as loading controls. The data are expressed as the means ± SD. *P < 0.05, **P < 0.001.
