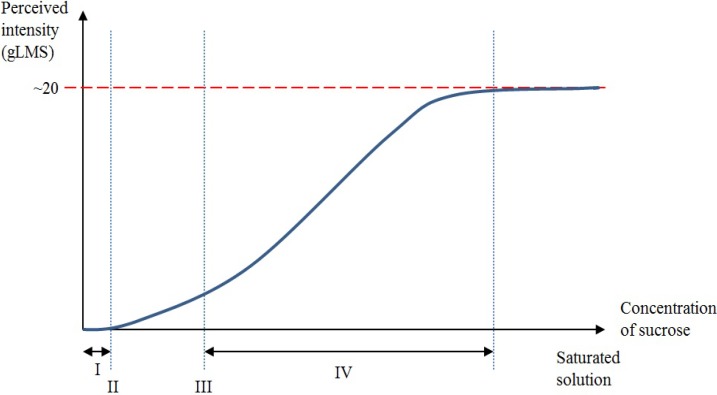
Figure 1.
Graphic representation of the relationship between detection threshold, recognition threshold, suprathreshold intensity and chemical concentration levels. The x-axis of the graph represents the chemical concentration level from no concentration of sucrose in the aqueous solution (0 molar) to a saturated sucrose solution. The y-axis represents the general Labelled Magnitude Scale (gLMS) from no perception to a conjectural terminal threshold. (I) A small amount of sucrose diluted in an aqueous solution could not be detected at a low concentration. (II) A detection threshold is reached whereby the sucrose solution can be told apart from water. At this stage, the taste quality remains unidentified. (III) The recognition threshold is reached whereby the correct taste quality can be recognized. (IV) Suprathreshold intensity is defined as the dynamic phase where the perceived intensity of sweetness jointly increases to a hypothetical asymptote as the concentration of sucrose increases. Further increases following the dynamic phase no longer cause subsequent increases in perceived intensity.

