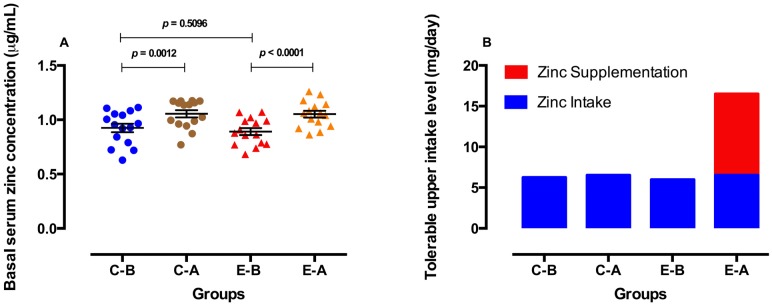
Figure 2.
Basal serum zinc concentrations (A) and tolerable upper intake level of zinc (B) before and after 3 months of placebo (control group) or oral zinc supplementation (experimental group). C-B = Control-Before, C-A = Control-After, E-B = Experimental-Before, E-A = Experimental-After. Concentrations are expressed as the mean ± SEM. p values were calculated using paired and unpaired Student’s t tests. All comparisons were considered to be statistically significant at the 5% level (p < 0.05). (The previous figure was replaced by the current.).

