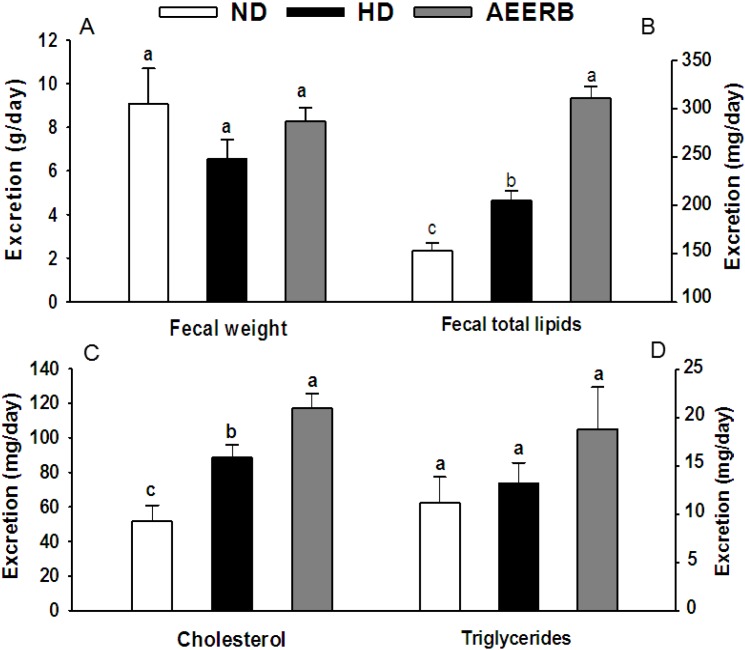
Figure 1.
Fecal weight (A); total lipids (B); cholesterol (C) and triglycerides (D) of the experimental rats. The values are the mean ± SD (n = 3). Different superscript letters indicate significant differences at p < 0.05. ND, normal diet; HD, hyperlipidemic diet; AEERB, hyperlipidemic diet + 750 mg/kg/day of AEERB.

