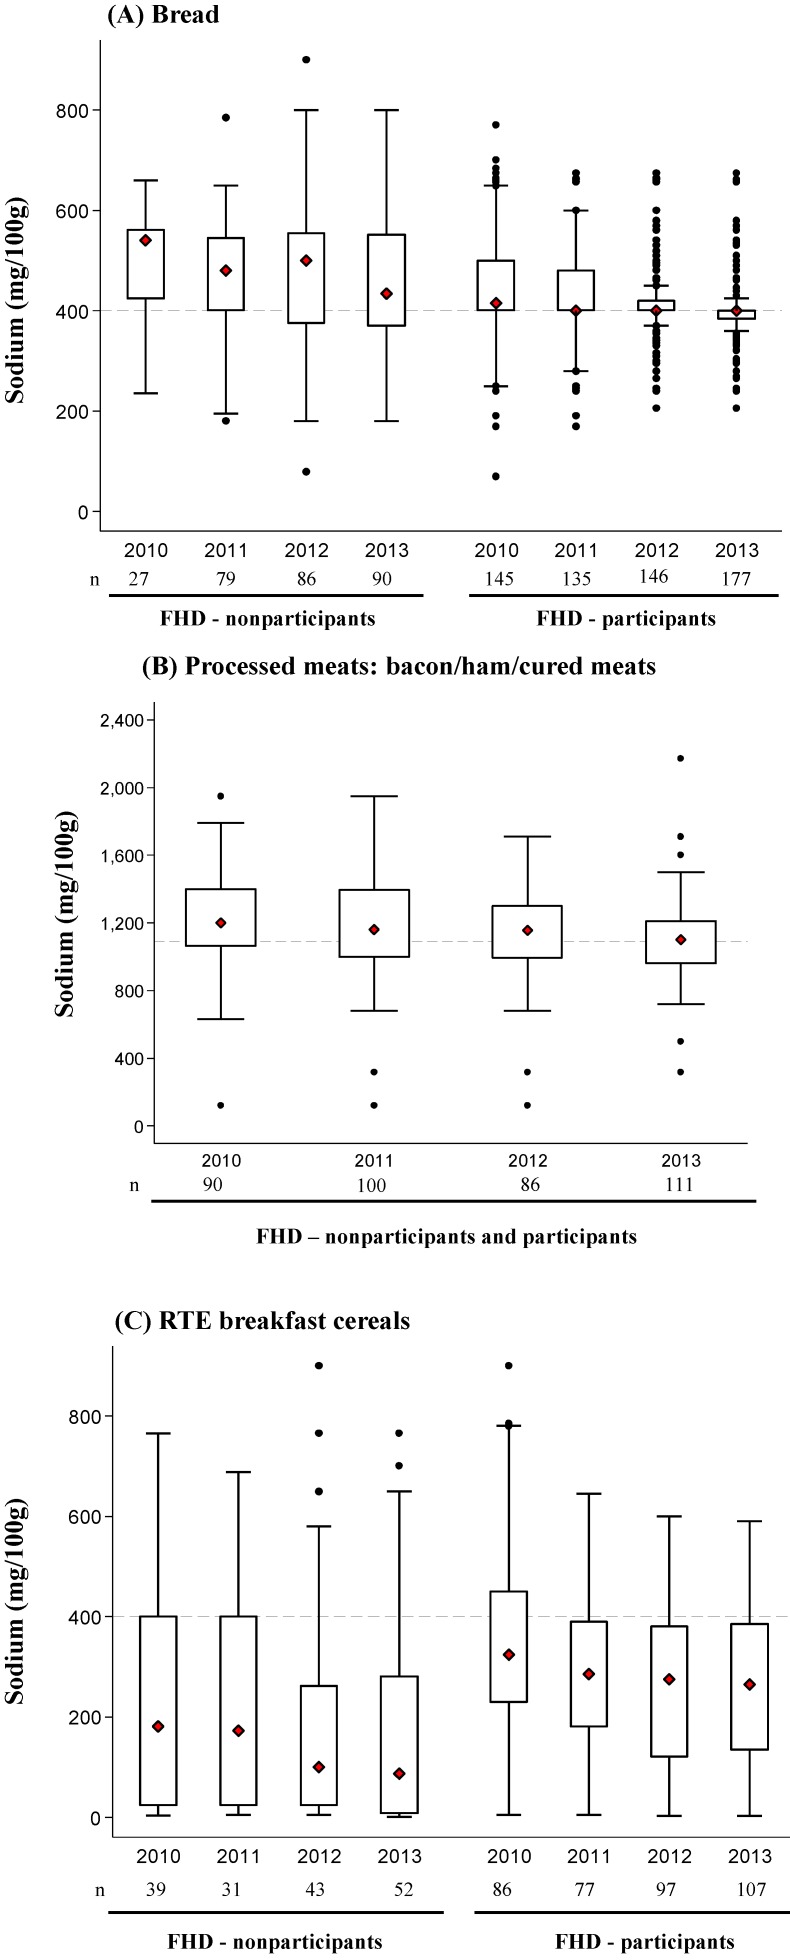
Figure 3.
Distribution of sodium values from 2010 to 2013 for (A) bread, (B) ham/bacon/cured meats and (C) ready-to-eat (RTE) breakfast cereals. The box displays the interquartile range, and the median value is marked as a diamond. The lines extending above and below the box indicate the most extreme value within the 75th percentile + 1.5x (interquartile range) and the 25th percentile − 1.5x (interquartile range), and additional values outside of this range are marked as black circles. Values are shown separately for FHD participants and non-participants for bread and RTE cereal, but not processed meats, for which the great majority (~90% in each year) were supplied by FHD participants.

