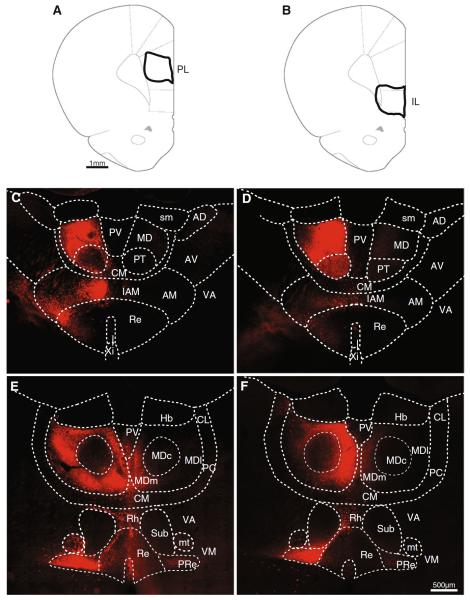
Fig. 2.
Thalamic populations projecting to mPFC. a, b Schematic diagrams with the outlines of prelimbic (left) and infralimbic (right) injections. c, d Examples of retrogradely labeled cells at two anteroposterior levels in the thalamus (coronal sections, 20×); each example corresponds to the injections indicated with solid lines in the diagrams. c, d Are more anterior than e, f. PL prelimbic; IL infralimbic; PV paraventricular; CM central medial; MD mediodorsal (subdivisions: central, lateral and medial indicated as MDc, MDl and MDm, respectively); PT parataenial; sm stria medullaris; AD anterodorsal; AV anteroventral; AM anteromedial; IAM interanteromedial; VA ventral anterior; VM ventral medial; Re reuniens; PRe perireuniens; Xi xiphoid; Hb habenula; CL central lateral; PC paracentral; Rh Rhomboid; Sub submedial; mt mamillothalamic tract

