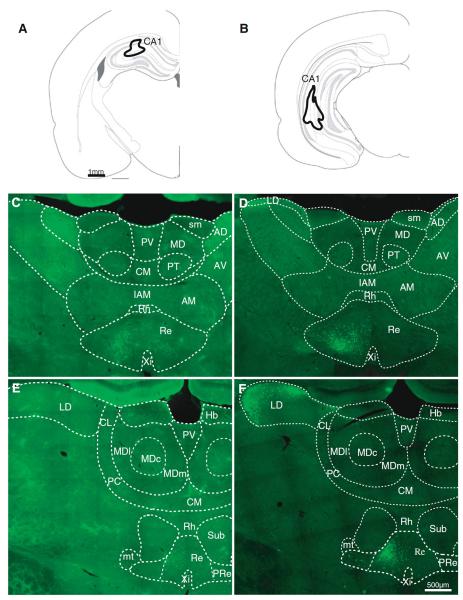
Fig. 3.
Thalamic populations projecting to hippocampus. a, b Diagrams of two injections in dorsal and ventral hippocampus. c–f Examples of retrogradely labeled cells (coronal sections, 20×) at two anteroposterior thalamic levels from the injections shown above; c, d more anterior than e, f. LD lateral dorsal; other abbreviations as in Fig. 2

