Fig. 4.
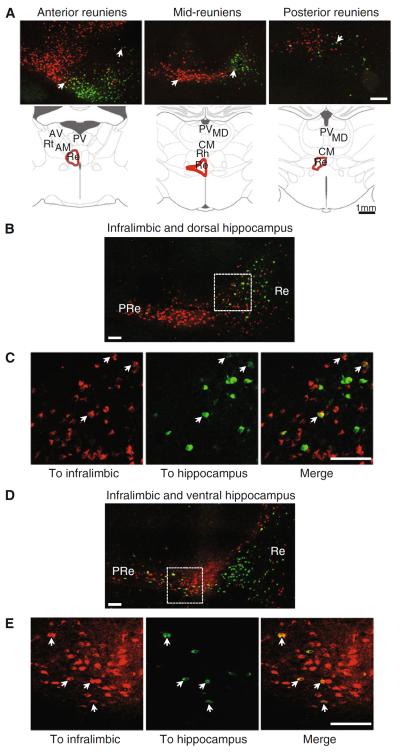
Single and double-labeled cells in reuniens. a Confocal microscope images of the nucleus reuniens at three anteroposterior anatomical levels indicated by the diagrams below, showing the topography of the mPFC-projecting (red) and hippocampus-projecting (green) populations. White arrows indicate examples of double-labeled cells. b Confocal image of the nucleus reuniens after injections in infralimbic (red) and dorsal hippocampus (green); c close-up view of the boxed area in (b) with examples of double-labeled cells indicated by white arrows. d Confocal image of the nucleus reuniens after injections in infralimbic (red) and ventral hippocampus (green). e Close-up views of the area inside the white dashed box arrows indicate double-labeled cells. Re reuniens; PRe perireuniens. Scale bars 200 μm in (a), 100 μm in (b–e)

