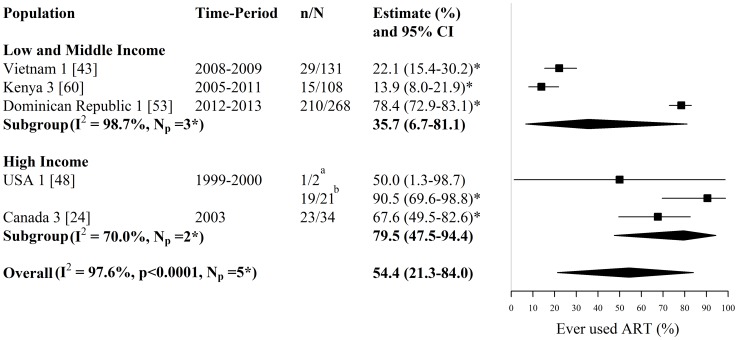
Figure 5. Forest plot of ever ART use among HIV-infected FSWs.
Study estimates are grouped by country income and ordered by time-period. The star symbol (*) highlights the study estimates (one per study population) included in the pooled overall or subgroup estimates. I2 and p-values are the measures of heterogeneity used. a Sample is ‘active’ FSWs, b Sample is ‘active’ and ‘former’ FSWs. ART = antiretroviral therapy, FSW = female sex workers, CI = confidence interval, n = number of FSWs with each outcome, N = sample size of FSWs available for each outcome, Np = number of independent study populations.

