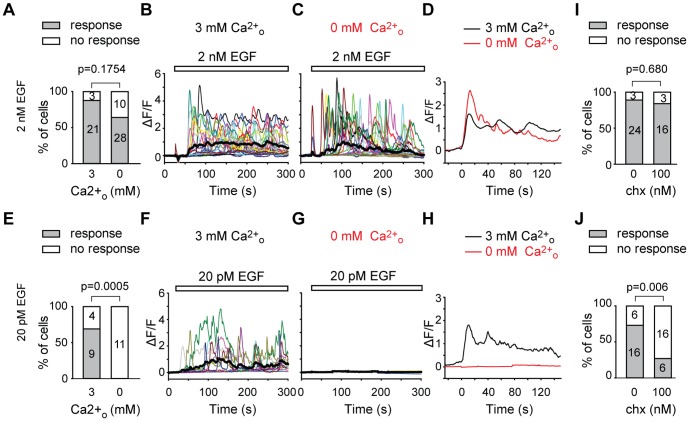
Figure 4. External Ca2+ dependence and sensitivity to K+ channel blocker charybdotoxin of EGF Ca2+ transients.
A/Proportion of cells responding (grey bar) or not responding (white bar) to 2 nM EGF in 3 mM extracellular Ca2+ (n = 24) or in 0 mM Ca2+/1 mM EGTA (n = 28) in the extracellular medium. B/Fluorescence intensity signaling of individual cells (each represented by a different color) during the application of 2 nM EGF (white bar) when 3 mM Ca2+ was present (n = 24). The averaged population signal is shown as a thick black trace. C/Fluorescence intensity of individual cells (each represented by a different color) during the application of 2 nM EGF (white bar) when Ca2+ was removed and 1 mM EGTA was added to the extracellular medium (n = 28). The averaged population signal is shown as a thick black trace. D/Average of all cell signals during 2 nM EGF application, synchronized at the time of the first fluorescence peak and averaged for 150 sec, when 3 mM Ca2+ was present (black line, n = 24) or when Ca2+ was removed from and 1 mM EGTA was added to the extracellular medium (red line, n = 28). E/Proportion of cells responding (grey bar) or not responding (white bar) to 20 pM EGF in 3 mM extracellular Ca2+ (n = 13) or in 0 mM Ca2+/1 mM EGTA (n = 11) in the extracellular medium. F/Fluorescence intensity of individual cells (each represented by a different color) during the application of 20 pM EGF (white bar) when 3 mM Ca2+ was present (n = 13). The averaged population signal is shown as a thick black trace. G/Fluorescence intensity of individual cells (each represented by a different color) during the application of 20 pM EGF (white bar) when Ca2+ was removed from and 1 mM EGTA was added to the extracellular medium (n = 11). The averaged population signal is shown as a thick black trace. H/Average of all cell signals during 20 pM EGF application, synchronized at the time the first fluorescence peak and for 150 sec, when 3 mM Ca2+ was present (black line, n = 13) or when Ca2+ was removed from and 1 mM EGTA was added to the extracellular medium (red line, n = 11). I/Proportion of cells responding (grey bar) or not responding (white bar) to 2 nM EGF in the absence (0, n = 24/27) or in the presence (100, n = 16/19) of 100 nM charybdotoxin (chx) in the extracellular medium. J/Proportion of cells responding (grey bar) or not responding (white bar) to 20 pM EGF in the absence (0, n = 16/22) or in the presence (100, n = 6/22) of 100 nM charybdotoxin (chx) in the extracellular medium.

