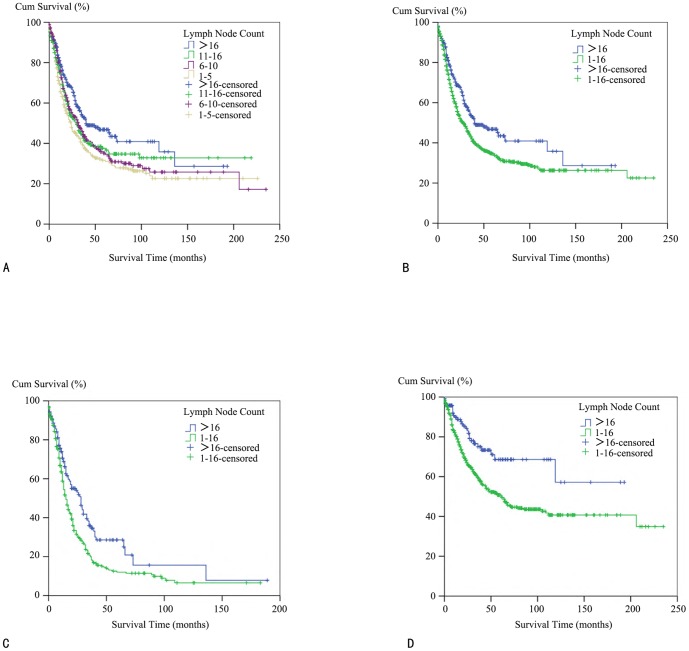
Figure 1. Kaplan–Meier survival analysis for invasive IPMN patients with different lymph node counts.
(A) A cancer-specific survival (CSS) curve for patients with lymph node count of 1–5, 6–10, 11–16 and over 16. (B) A cancer-specific survival (CSS) curve for patients with lymph node counts of 1–16 and over 16. (C) A cancer-specific survival (CSS) curve for N1 patients with lymph node counts of 1–16 and over 16. (D) A cancer-specific survival (CSS) curve for N0 patients with lymph node counts of 1–16 and over 16.

