
Table 2.
T- and p-values alertness and covert attention.
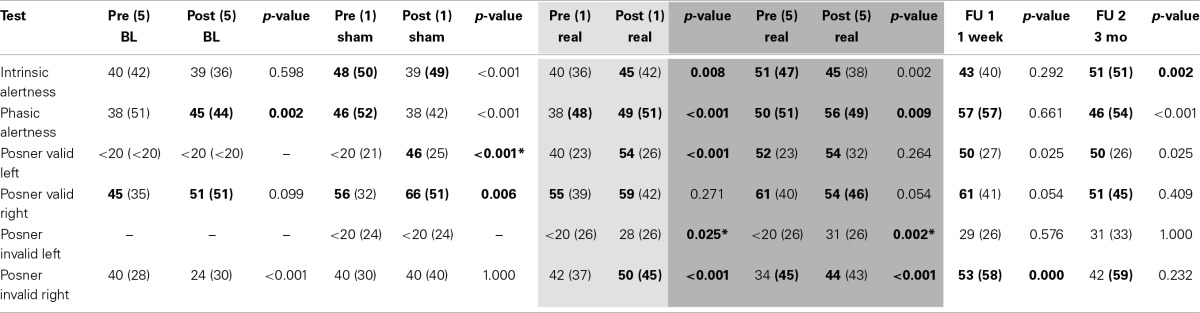
Abbreviations: BL, baseline standard therapy; (1): 1 therapy session; (5): 5 daily therapy sessions; FU 1, Follow-up 1 week after the end of stimulation (5 days of standard therapy); FU 2, Follow-up 3 months after the end of stimulation; Mo, months. –: Patient was not able to perceive stimuli and/or p-values could not be calculated (T < 20). Shading indicates time-periods of combined real tDCS and standard therapy (light gray: single real stimulation; dark gray: repeated real stimulation). T-values of median reaction time and of standard deviations are presented. P-values are two-sided. Bold font indicates performance levels within normal range of the norm population (T-values) or significant improvements (p-values).
*For T < 20 p-values were calculated using T = 20, significance of p-values for these time-points are therefore underestimated.