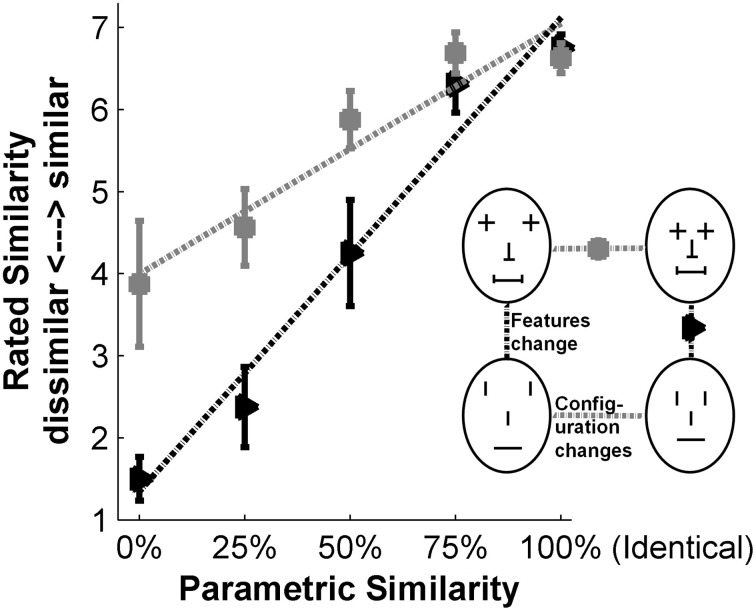
Figure 6.
Exemplar results of one German participant of the similarity ratings. For each of the five similarity levels, the average ratings across all face comparisons of all sets were calculated. The sensitivity ratings for changes in features (black triangles) and configuration (gray squares) are shown separately. The error bars depict standard error. A linear regression (y = βx + ε) was fitted to both curves individually (dotted black and dotted gray, respectively). The slopes (β) serve as measure of the sensitivity to features and configuration.

