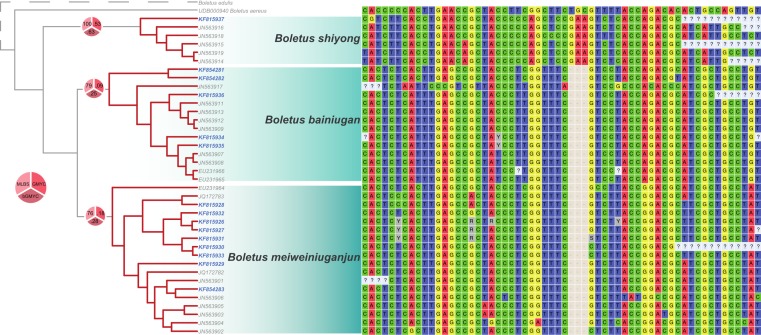
Figure 1. Phylogeny and alignment of three unnamed species discovered in a commercial packet of dried porcini.
On the left is an ultrametric tree rooted with Boletus aereus and with branch lengths transformed using the uncorrelated relaxed clock model in BEAST. The relationship of the core species or porcini, Boletus edulis, to the dataset is depicted using a dashed line. Clades with dark red branches represent the three maximum likelihood clusters in the GMYC model with the greatest ML score calculated using the single method in the ‘splits’ package in R. Terminal labels in blue represent sequences derived from individual pieces of mushroom sampled from a commercial packet of porcini. Pie charts on branches show maximum likelihood bootstraps (‘MLBS’; lightest red), GMYC supports (‘GMYC’; medium red), and posterior probabilities of the cluster as calculated using bGMYC (‘bGMYC’; darkest red). On the right is the alignment exported from Mesquite v2.75 (Maddison & Maddison, 2011) of 34 variable positions in the ITS region after excluding uninformative sites using PAUP* (Swofford, 2002). Nucleotide characters are depicted using IUPAC codes, gaps depicted by a ‘-’ and ambiguous/missing data depicted by ‘?’.

