
Figure 3.
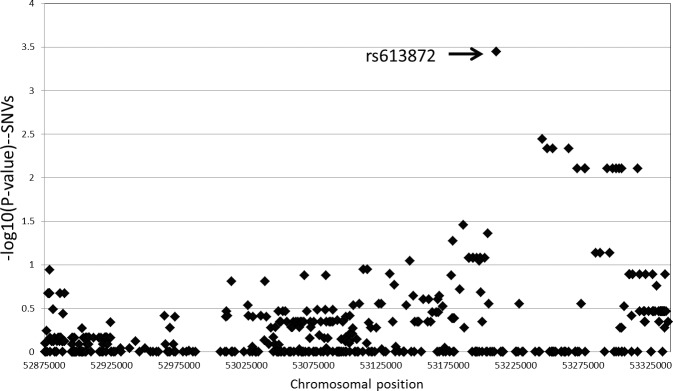
Odds ratios for SNVs across the targeted region. Odds ratios for individual SNVs across the capture region were calculated using a dominant model. Five hundred forty-six SNVs that passed filters and had a minor allele frequency of >5% are shown. The SNV with the highest odds ratio was rs613872, which has previously been associated with FECD by Baratz et al.13