
Figure 4.
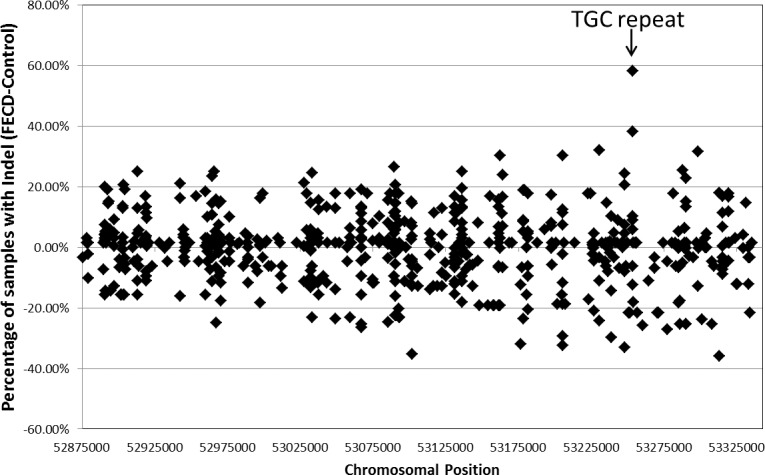
Distribution of indels in samples from FECD patients and controls. The difference in the percentage of affected and control samples that were called by the default NGS analysis pipeline to contain a specific indel allele at a specific location is shown. The TGC repeat expansion (marked) was called in 71% of affected samples and only 12% of controls.