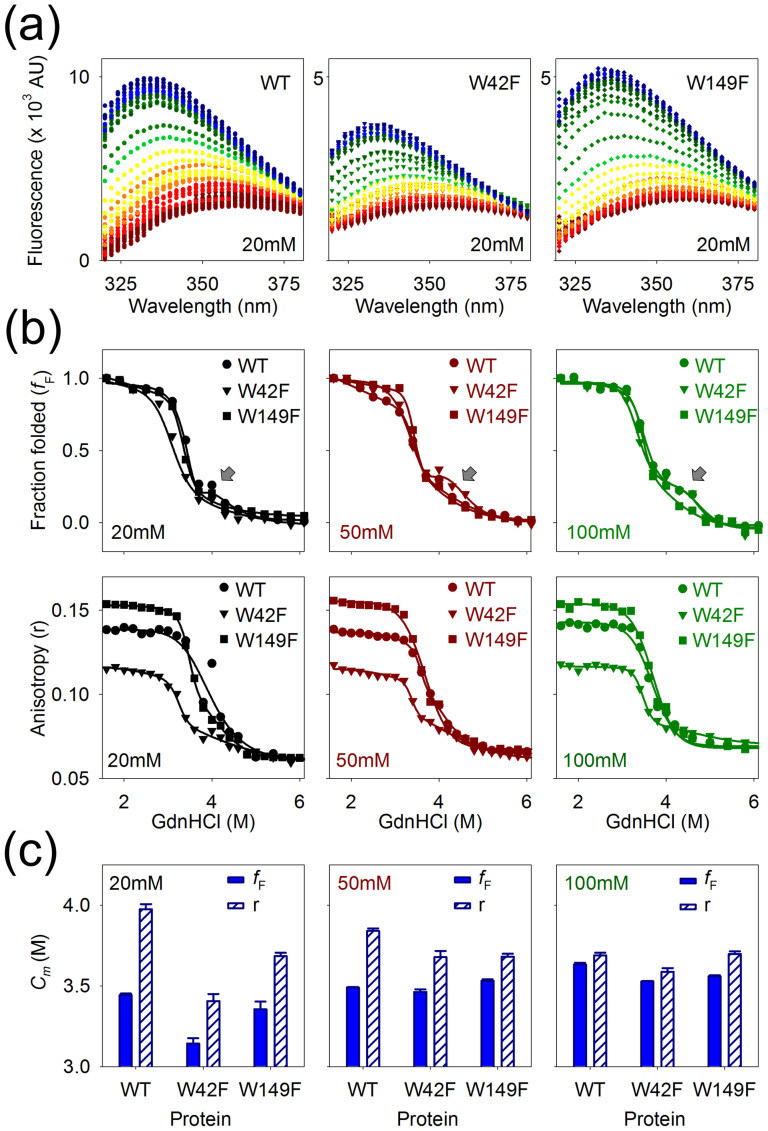
Figure 2. Refolding of Ail in LDAO micelles is largely DPR independent.
(a) Representative Trp emission profiles of Ail-WT and Trp mutants in 20 mM LDAO, highlighting the observed increase in fluorescence intensity and prominent blue shift in the λem-max (depicted in red to blue color scheme), as the protein refolds when GdnHCl is lowered from 8.0 M to 1.6 M (red to blue). The fluorescence intensity of Trp 149 in the W42F mutant is lower than Trp 42 in the W149F mutant. This is likely to arise from non-radiative losses in Trp 149 fluorescence, although the presence of a proximal quencher cannot be eliminated. (b) Fraction folded (fF) derived from Trp emission intensity at 330 nm (top) and corresponding anisotropy (r) values (bottom) for WT ( ), W42F (
 ) and W149F (
 ) in 20 mM (black), 50 mM (red) and 100 mM (green) LDAO. Data were collected at every 0.1 M increment of GdnHCl and the mean of two – three experiments were calculated. However, representative mean data points are shown in fF plots without error bars, for clarity. All samples (lower GdnHCl concentrations) were checked using gel mobility shift on SDS-PAGE for completion of the refolding process. While ~100% refolding was observed, the presence of trace amounts of unfolded protein cannot be completely excluded. Representative data are shown for the anisotropy experiments. Fits are shown as solid lines and corresponding LDAO concentrations are indicated in each plot. Note the appearance of an intermediate (indicated by an arrow) at ~4.0 M GdnHCl only in the fF plots of W42F in all LDAO concentrations, and additionally in WT in 100 mM LDAO. (c) Cm values obtained from fF (blue, solid fill) and anisotropy (r) (blue, diagonal stripes) data are compared for the three Ail constructs across various LDAO concentrations. Note that the Cm values are different only in 20 mM LDAO (DPR 700:1) and are largely analogous in 50 mM (DPR 1750:1) and 100 mM (DPR 3500:1) LDAO. Error bars represent goodness of fits. Also see Supplementary Figs. 2–4.

