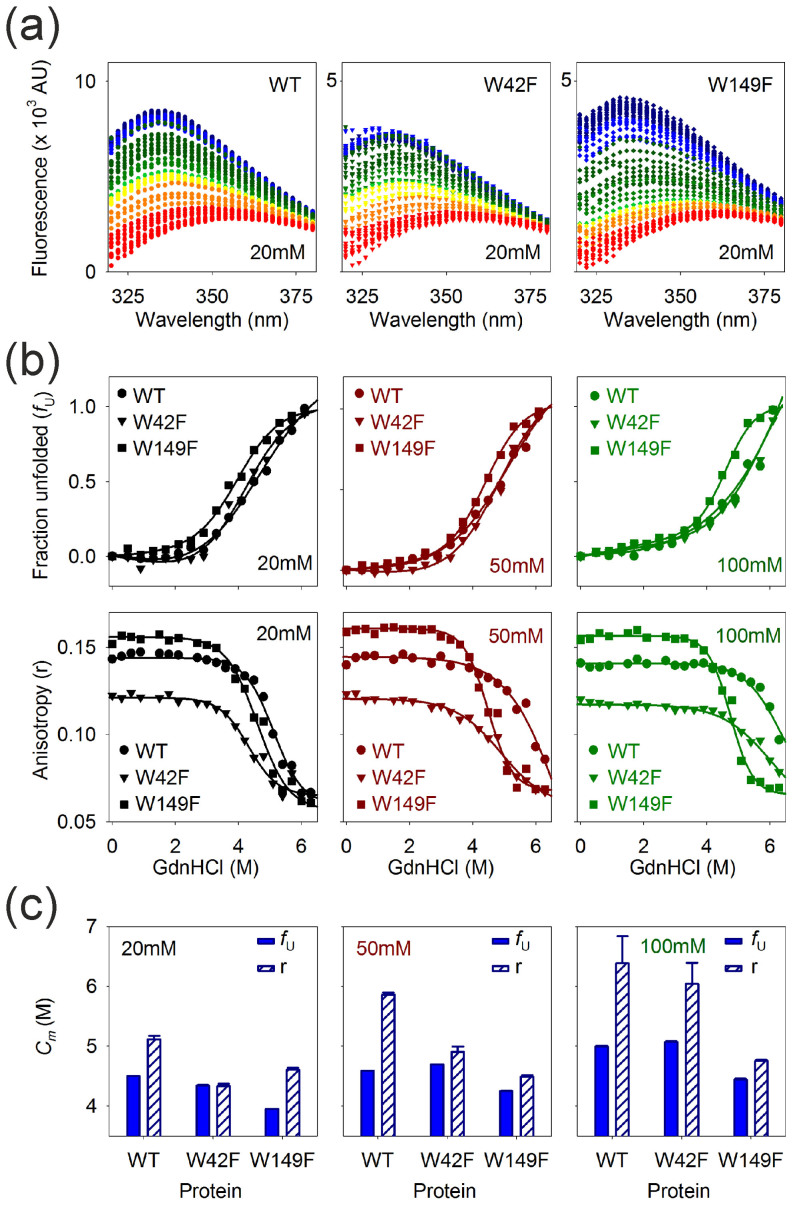
Figure 4. Ail unfolds in a DPR-dependent manner.
(a) Representative Trp emission profiles of Ail-WT and Trp mutants in 20 mM LDAO, highlighting the observed reduction in fluorescence intensity accompanied by a prominent red shift in the λem-max (depicted in red to blue color scheme), as the refolded protein unfolds when GdnHCl is increased from 0 M to 6.4 M (blue to red). (b) GdnHCl-dependent unfolding of Ail monitored through Trp fluorescence, plotted as the variation in unfolded fractions (fU) (top graphs), and the corresponding anisotropy (r) change (bottom graphs), with increasing denaturant concentration. Symbol and color codes for Ail-WT ( ), W42F (
 ) and W149F (
 ) are black (20 mM), red (50 mM) and green (100 mM) LDAO. Data collected at increments of 0.1 M GdnHCl from two – three independent experiments were used to calculate the mean fU data set. Shown here are representative points from the mean data without the error bars, for clarity. A representative dataset is provided for anisotropy plots. Fits are shown as solid lines and respective LDAO concentrations are provided in each plot. (c) Plots of Cm values obtained from fU (blue, solid fill) and anisotropy (r) (blue, diagonal stripes) data for the three Ail constructs across various LDAO concentrations. Note the increase in Cm with increasing LDAO (and DPR) in the case of WT and W42F, while W149F is less affected by changes in DPR. Error bars represent goodness of fits. Also see Supplementary Figs. 5–9.

