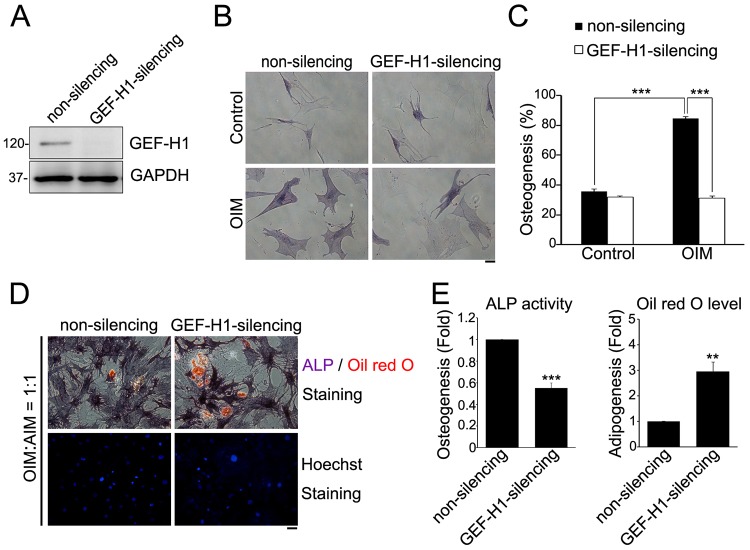
Fig. 1.
MSCs osteogenesis versus adipogenesis depends on GEF-H1 expression. (A) The expression of GEF-H1 and GAPDH in non-silencing and GEF-H1-silencing MSCs was analyzed by western blotting. (B) Non-silencing and GEF-H1-silencing MSCs were treated with control culture medium or osteogenesis induction medium (OIM) for 14 days and stained for the activity of ALP. Scale bar: 50 µm. (C) The percentage of cells showing osteogenesis (ALP-positive cells). Data are mean±s.e.m. [non-silencing MSCs: n = 60 cells (control); n = 111 cells (OIM); GEF-H1-silencing MSCs: n = 82 cells (control); n = 77 cells (OIM)]. ***P<0.0001. (D) Non-silencing and GEF-H1-silencing MSCs were treated with mixed differentiation medium (OIM∶AIM = 1∶1) for 14 days, and stained for the presence of lipid (Oil Red O; red), the activity of ALP (purple) and Hoechst 33342 (blue). Scale bar: 50 µm. (E) Fold change in cells showing osteogenesis (ALP activity) or adipogenesis (Oil Red O level) in GEF-H1-silencing MSCs relative to non-silencing MSCs. Data are mean±s.e.m (non-silencing: n = 571 cells; GEF-H1-silencing: n = 348 cells). ***P<0.0001, **P<0.005.

