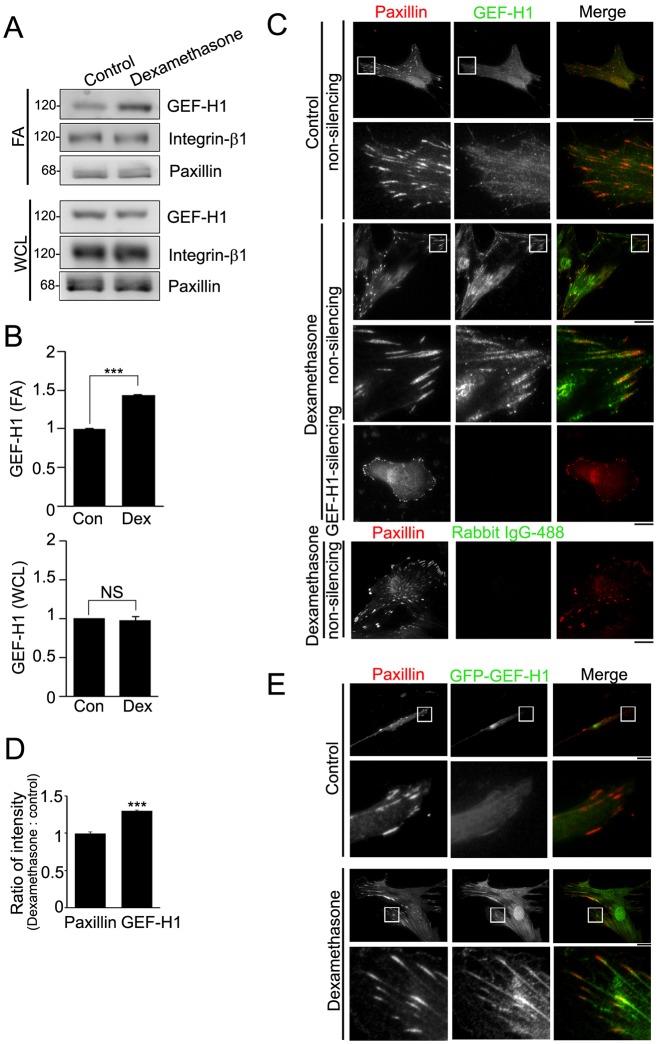
Fig. 3.
GEF-H1 is enriched in Dex-stimulated FAs. (A) FA fraction (FA) and whole-cell lysate (WCL) from serum-starved MSC-3A6 cells treated with ethanol (control) or Dex (0.1 µM) for 6 h were analyzed by western blotting. (B) Densitometry analysis of western blots showing the ratio of GEF-H1 in FA and WCL from MSC-3A6 cells treated with Dex relative to ethanol (Con). Data are mean±s.e.m. (n = 3 for each condition). ***P<0.0001. NS, not significant. (C) TIRF images of immunolocalized paxillin (red) and GEF-H1 (green) or anti-rabbit-IgG antibody conjugated to Alexa Fluor 488 (green) in serum-starved non-silencing or GEF-H1-silencing MSCs treated with ethanol (control) or Dex (0.1 µM) for 6 h. Scale bars: 20 µm. The boxed 20 µm×20 µm areas indicated in the upper image rows are magnified in the row below. (D) Ratio of average density (intensity per µm2) of paxillin or GEF-H1 within segmented FAs of non-silencing MSCs treated with Dex relative to control. Data are mean±s.e.m. (n = 10 cells for each condition). ***P<0.0001. (E) Serum-starved MSCs overexpressing GFP–GEF-H1 (green) and treated with ethanol (control) or Dex (0.1 µM) for 6 h were immunostained for paxillin (red). Scale bars: 20 µm. The boxed 20 µm×20 µm areas indicated in the upper image rows are magnified in the row below.

