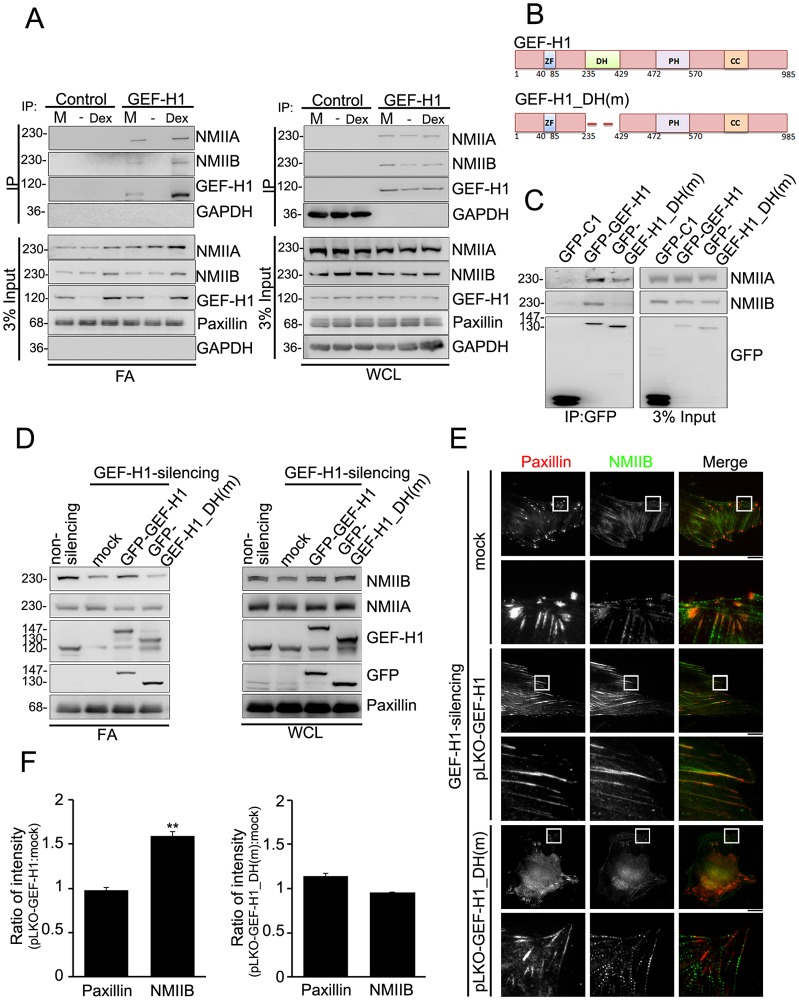
Fig. 5.
GEF-H1 recruits NMIIB to FAs through its DH domain. (A) FA fraction (FA) and whole-cell lysate (WCL) from MSC-3A6 cells treated with control culture medium (M) or serum-starved MSC-3A6 cells treated with ethanol (–) or Dex (0.1 µM) for 6 h was immunoprecipitated using the control (rabbit anti-GAPDH) or anti-GEF-H1 antibodies, and analyzed by western blotting. The 3% input of FA fraction was analyzed by western blotting. (B) Diagram of the domain structures of GEF-H1 and GEF-H1_DH(m). ZF, zinc-finger motif; DH, Dbl homology domain; PH, pleckstrin homology domain; CC, coiled-coil domain. (C) Whole-cell lysates from serum-starved MSC-3A6 cells expressing GFP–C1, GFP–GEF-H1 or GFP–GEF-H1_DH(m) treated with Dex (0.1 µM, 6 h) were immunoprecipitated using GFP-Trap beads. The immunoprecipitated complexes and the 3% input of whole-cell lysate were then analyzed by western blotting. (D) The FA fraction (FA) and the whole-cell lysate (WCL) from serum-starved non-silencing and GEF-H1-silencing MSC-3A6 cells expressing pGFP-C1 (mock), pGFP-GEF-H1 or pGFP-GEF-H1_DH(m) and treated with Dex (0.1 µM, 6 h) were analyzed by western blotting. (E) TIRF images of immunolocalized paxillin (red) and NMIIB (green) in GEF-H1-silencing MSCs expressing pLKO-vector (mock), pLKO-GEF-H1, or pLKO-GEF-H1_DH(m) and treated with Dex (0.1 µM, 6 h). Scale bars: 20 µm. The boxed 20 µm×20 µm areas indicated in the upper image rows are magnified in the row below. (F) Ratio of average density (intensity per µm2) of paxillin or NMIIB within segmented FAs of GEF-H1-silencing MSCs expressing pLKO-GEF-H1 relative to mock, or GEF-H1-silencing MSCs expressing pLKO-GEF-H1_DH(m) relative to mock (n = 11 cells for each condition). Data are mean±s.e.m. **P<0.005.

