Fig. 7.
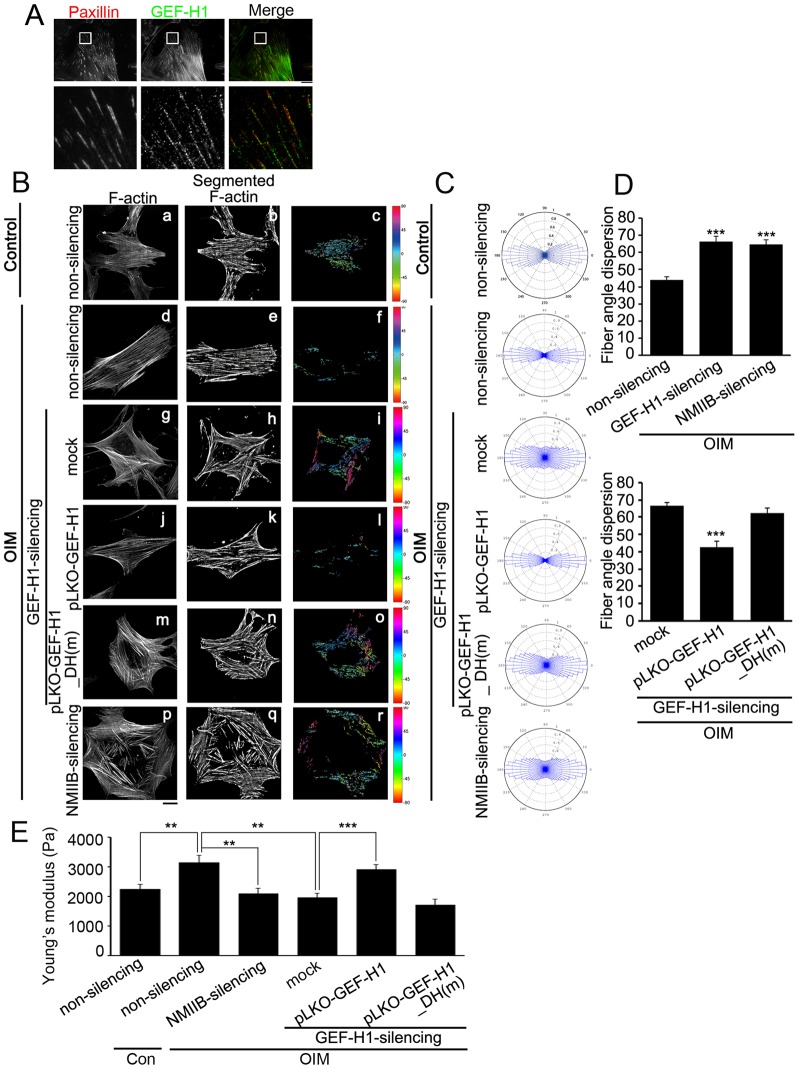
GEF-H1-mediated FA recruitment of NMIIB controls cytoskeletal mechanics. (A) TIRF images of immunolocalized paxillin (red) and GEF-H1 (green) in MSCs treated with OIM for 48 h. Scale bar: 20 µm. The boxed 20 µm×20 µm areas indicated in the top images are magnified in the images below. (B) Non-silencing MSCs treated with control culture medium (a–c), non-silencing MSCs (d–f), GEF-H1-silencing MSCs expressing pLKO vector (mock) (g–i), pLKO-GEFH1 (j-l) or pLKO-GEF-H1_DH(m) (m–o), and NMIIB-silencing MSCs (p–r) were treated with OIM for 48 h, and immunostained with FITC–phalloidin, to localize F-actin (a, d, g, j, m and p). Scale bar: 20 µm. After image segmentation, the image was rotated to set the median stress-fiber-orientation as horizontal (b, e, h, k, n and q). The orientation of each fiber was depicted with a specific color as indicated by the color at the right-hand side of each panel (c, f, i, l, o and r). (C,D) The polar histograms (C) and spread distribution (D) of stress fiber orientations were statistically calculated (n = 15 cells for each conditions). Data are mean±s.e.m. ***P<0.0001 (D, top, compared with non-silencing; bottom, compared with mock). (E) Stiffness (Young's modulus; Pa) of non-silencing MSCs treated with control culture medium (n = 49 cells) and non-silencing (n = 50 cells), NMIIB-silencing (n = 33 cells) and GEF-H1-silencing MSCs expressing pLKO-vector (mock) (n = 39 cells), pLKO-GEFH1 (n = 35 cells) or pLKO-GEF-H1_DH(m) (n = 48 cells) were treated with OIM for 48 h. Data are mean±s.e.m. **P<0.005, ***P<0.0001.

