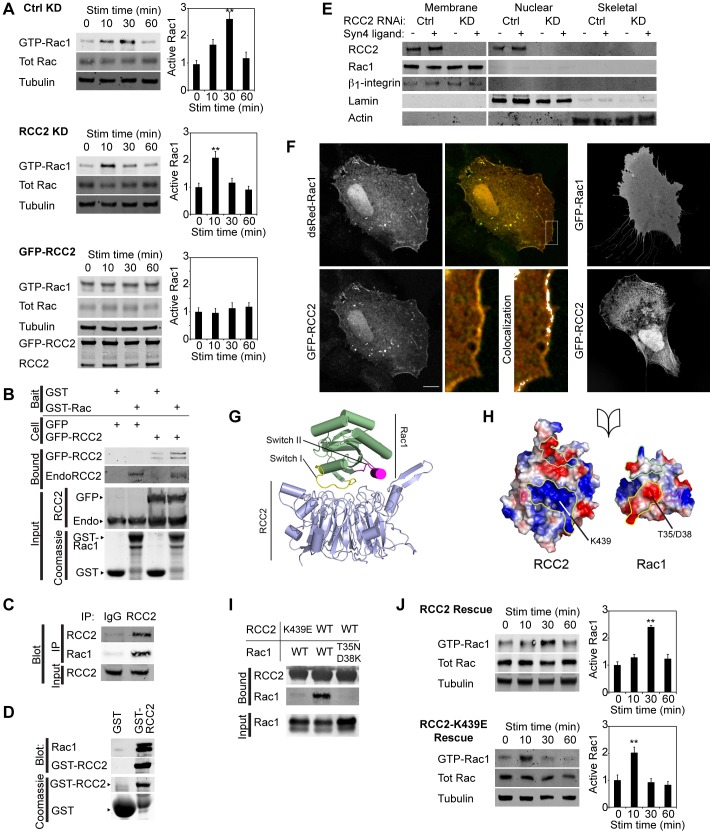
Fig. 1.
RCC2 retards Rac1 activation at the membrane. (A) H/0-stimulated Rac1 activation in control (Ctrl) and RCC2-knockdown (KD) MEFs (oligonucleotide no. 1, n = 7), and MEFs overexpressing GFP–RCC2 (n = 4). siRNA against RCC2 with an alternative oligonucleotide, and pairwise comparison of time points and RCC2 expression from the same experiments, is shown in supplementary material Fig. S1A–C. Stim, simulation; tot, total. (B) Pull down of endogenous RCC2 (60 kDa) and exogenous GFP–RCC2 (87 kDa) from 293T cells using GST or GDP-loaded GST–Rac1 as bait, n = 6. (C) Endogenous RCC2 and Rac1 co-immunoprecipitate (IP) from MEFs, n = 6. (D) Pull down of recombinant GDP-loaded Rac1 using GST–RCC2, n = 8. (E) Protein distribution between total membrane, nuclear and cytoskeletal fractions using a Qproteome kit. Comparison of control and RCC2-knockdown fibroblasts, with and without syndecan-4 engagement. n = 7. (F) Images of fibroblasts expressing GFP–RCC2, dsRed–Rac1 or both spread on fibronectin with serum and fixed. Colocalization tested by ImageJ. The magnified image is of the boxed area. Scale bar: 10 µm. (G) Ribbon diagram of the modeled GDP-Rac1–RCC2 complex. (H) Open-book representation of the binding interface between RCC2 and GDP-Rac1 outlining the first (yellow), second (green) and third (magenta) interaction sites. Surface charges, depicted as acidic (red) or basic (blue), complement one another at the interaction sites. (I) Interaction between GFP–RCC2 and recombinant GDP–loaded Rac1 was blocked by mutation of an interaction site in either molecule, n = 4. (J) H/0-stimulated Rac1 activation in RCC2-knockdown MEFs rescued with GFP–RCC2-K439E or GFP–RCC2, n = 4. Results are mean±s.e.m. *P<0.05, **P<0.005 (ANOVA).

