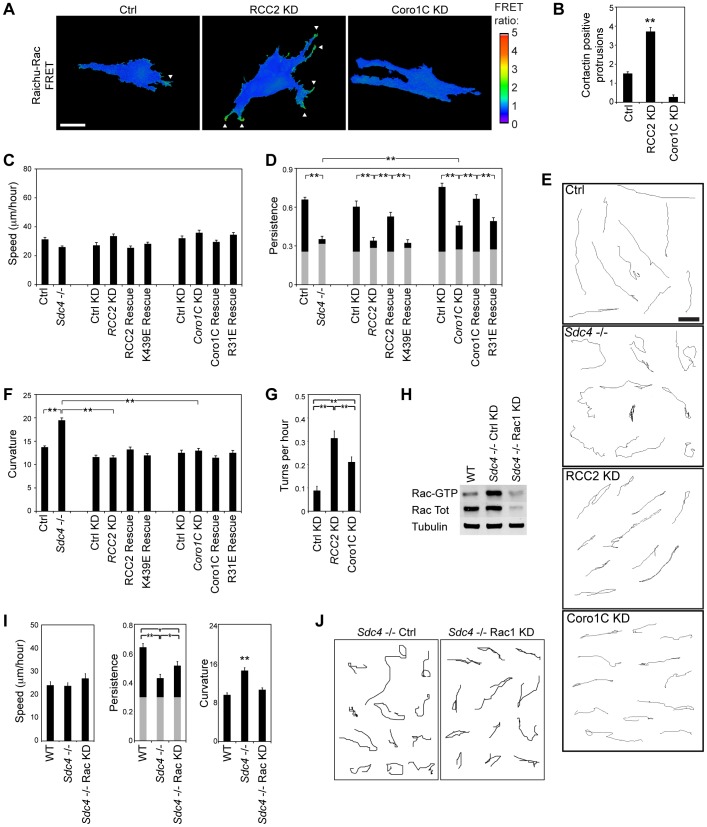
Fig. 7.
Localization of Rac1 signals by RCC2 and Coro1C is necessary for processive migration. (A) Distribution of active Rac1 (arrows) in control (Ctrl), RCC2-knockdown (KD) and Coro1c-knockdown MEFs embedded into CDM measured using a Raichu-Rac1 activity reporter. Images are representative of 10 experiments. Scale bar: 10 µm. (B) MEFs embedded into CDM were scored for cortactin-positive protrusions, images are shown in supplementary material Fig. S4A, n = 56. (C–F) 10-h migration characteristics of cell types embedded into CDM. (C) Speed (distance/time). (D) Persistence (displacement/distance), gray bars indicate the experimentally determined threshold for random migration on 2D substrate. (E) Example migration tracks. Scale bar: 100 µm. (F) Curvature (see Materials and Methods, and supplementary material Fig. S4D). (G) Frequency of migration turns on 5-µm fibronectin stripes. (H) Knockdown of total Rac1 in sdc4−/− MEFs caused a concomitant loss of GTP-Rac1. WT, wild-type. (I,J) 10-h migration characteristics of cell types embedded into CDM. Results represent analysis of >100 cells per condition. Results are mean±s.e.m. *P<0.05, **P<0.005 (Kruskal–Wallis test).

