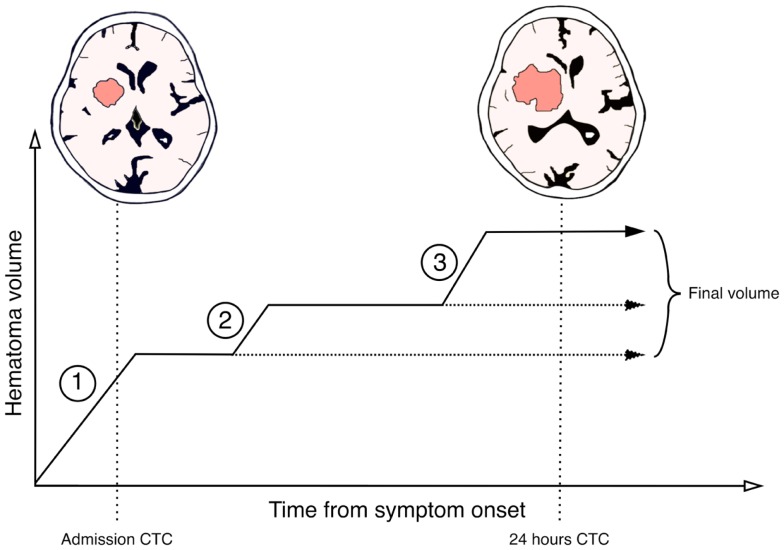
Figure 1.
Suggested schematic model for a step-wise hematoma expansion-profile in intracerebral hemorrhages. Phase 1 represents the initial active bleeding-period most likely caused by the originally ruptured vessel. If patients are admitted within this phase an active hemorrhage will still be occurring post-admission and instant expansion can be observed. After phase 1 a plateau-phase might exist in which the hematoma volume is constant or active bleeding occurs slowly. In some patients, this phase might represent the final hematoma volume (horizontal stippled line). Phase 2 represents a secondary bleeding-period. This is likely due to secondary vessel rupture caused by pressure and ischemia on adjacent tissue structures or by re-bleeding from the originally ruptured vessel. Some patients might have multiple secondary bleeding-periods and some even late (phase 3). Between these periods are interpolated plateau-phases with relative constant hematoma volume or slow active bleeding. This results in the final hematoma volume observed on follow-up imaging.

