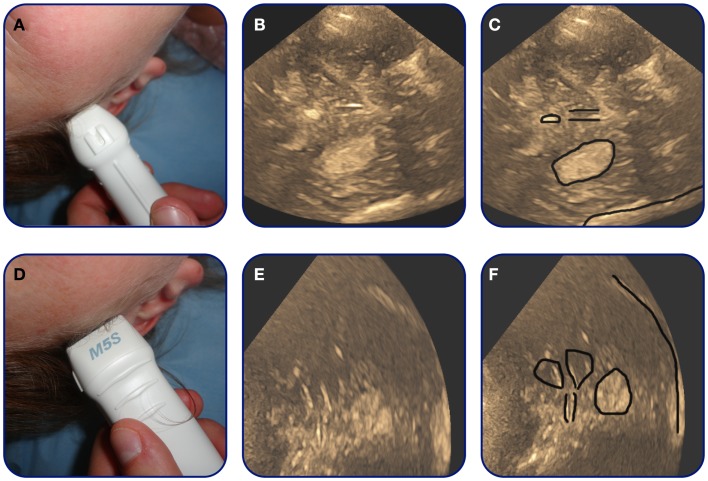
Figure 7.
Transcranial duplex sonography-images of basal-ganglia hemorrhage. A patient with basal-ganglia ICH. On axial images (A,B) the hematoma can be observed as a hyperechogenic region in the middle of the picture. The rim of the hematoma is marked by black on (C). In addition on (C) the location of important midline landmark structures as the pineal gland and the third ventricle are marked. (D,E) Are coronal images. On (F) the lateral ventricles, the third ventricle, and the hematoma is marked.

