
Figure 5.
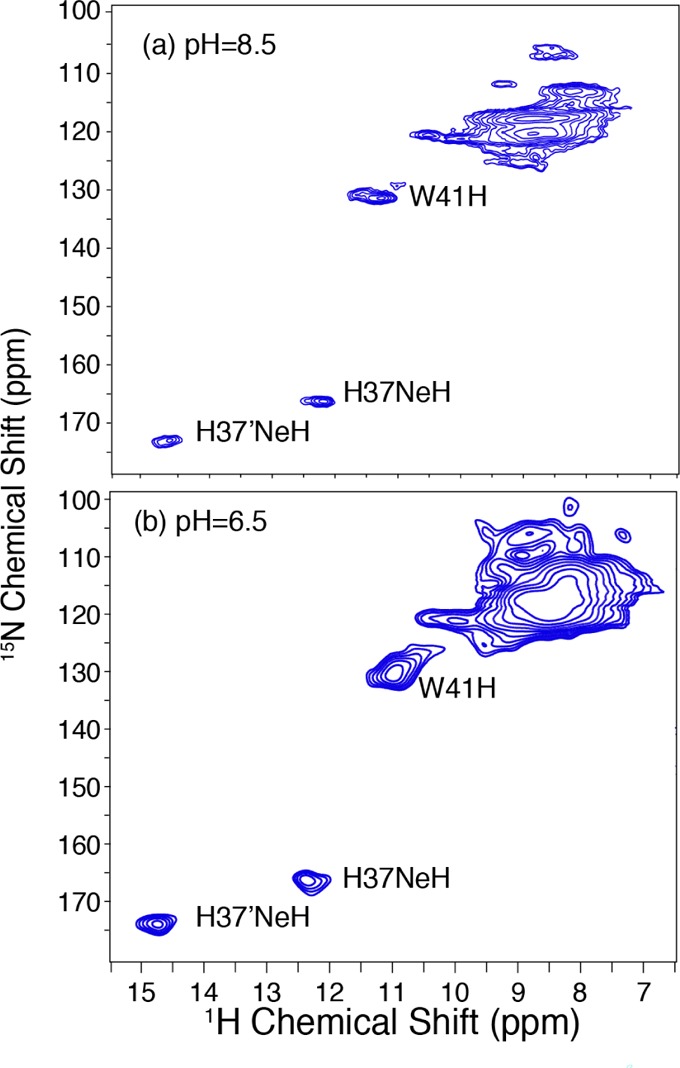
1H detected 1H–15N MAS correlation spectra at (a) pH 8.5 and (b) pH 6.5 of M218–60 H57Y ILFY (CP contact time 1 = 1.5 ms, CP contact time 2 = 0.2 ms. ω0I/2π = 750 MHz, ωr/2π = 60 kHz, 15 kHz TPPM decoupling, T = 30 °C).
Official websites use .gov
A
.gov website belongs to an official
government organization in the United States.
Secure .gov websites use HTTPS
A lock (
) or https:// means you've safely
connected to the .gov website. Share sensitive
information only on official, secure websites.
1H detected 1H–15N MAS correlation spectra at (a) pH 8.5 and (b) pH 6.5 of M218–60 H57Y ILFY (CP contact time 1 = 1.5 ms, CP contact time 2 = 0.2 ms. ω0I/2π = 750 MHz, ωr/2π = 60 kHz, 15 kHz TPPM decoupling, T = 30 °C).