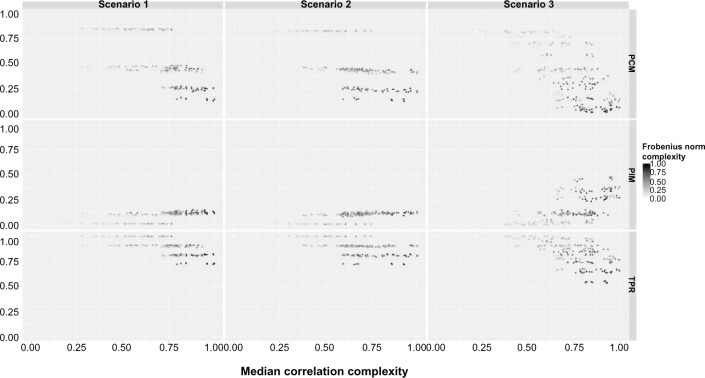
Figure 2.
Bayesian approach. The percentage of correctly selected models (PCM), the percentage of incorrectly selected models (PIM), and the true positive rate (TPR) are plotted against the median correlation complexity measure (MCC) for each scenario. The gradient reflects the Frobenius norm complexity measure (FNC) level.

