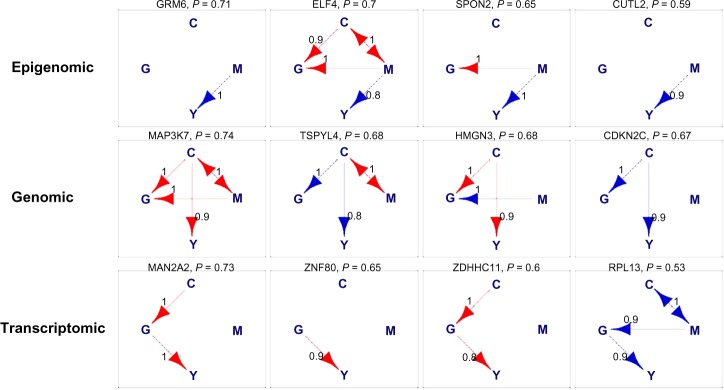
Figure 5.

Glioblastoma multiforme (GBM) data analysis. Top four networks for epigenomic, genomic, and transcriptomic networks. They are ranked based on the posterior probability which is shown at the top of each network, along with the corresponding gene/probe symbol.
Notes: Blue arrows are activations. Red arrows are inhibitions. Bi-directed edges can be interpreted in either direction. Next to each arrow is the posterior probability of the corresponding arrow.
