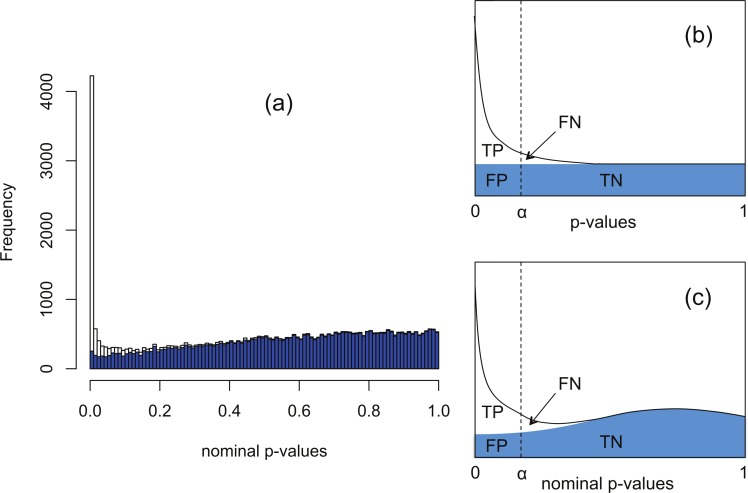
Figure 1. The Polyfit procedure.
(A) Histogram of the nominal p-values calculated by DESeq for synthetic data RNA-seq with 15% genes up- or down-regulated. The shaded histogram superimposed is the 85% of transcripts which are unregulated. (B) Schematic representation of the Storey–Tibshirani procedure for correcting for multiple hypothesis testing, assuming correctly calculated p-values. (C) Schematic representation of the Storey–Tibshirani procedure adapted to RNA-seq data. By ‘nominal p-values’ we mean p-values as calculated by a computer package relying on a NB model using estimated parameters, such as DESeq or edgeR. (TP, true positives; FP, false positives; FN, false negatives; TN, true negatives at a specified significance point α.)

