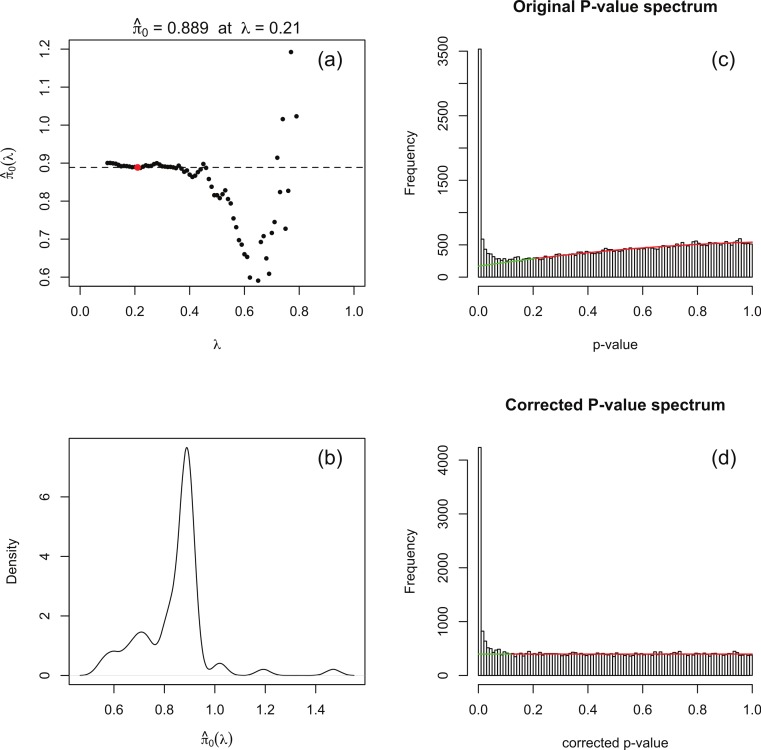
Figure 3.
(A) Estimates of the fraction π0 of genes not DE obtained by fitting a quadratic function to the original input (without the flagpole) p-value histogram over the interval [λ, 1]. (B) Density plot of obtained estimates . The optimal λopt (red dot in (A)) is obtained by choosing the closest to the mode of the density. The mode is also indicated by the dotted line in (A). The original and corrected p-value histograms are shown in (C) and (D), together with optimally fitted quadratic in (C) and its image after correction in (D). The red part of the quadratic is the interval [λopt, 1] in (C) and its image in (D). This example is generated from synthetic data for which the true value of π0 is 0.85.

