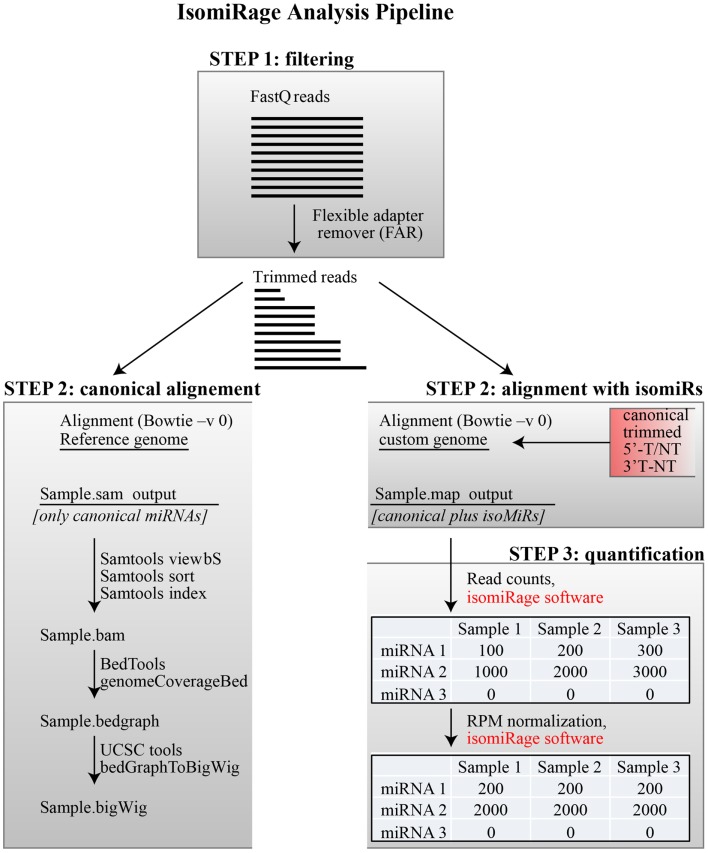
Figure 1.
IsomiRage pipeline. A schematic representation of the miRNA analysis workflow is shown, distinguishing the three main steps described in the text. Alignment of trimmed FastQ reads (Step 2) is carried out either using a reference genome for the production of browser viewable tracks or to custom sequence libraries for quantitative analyses of miRNA and their isoforms. The quantification of mapped reads in this latter case is performed through an ad hoc java application called IsomiRage, which also performs the read-per-million normalization and provides, for each miRNA, the different kinds of modifications found.

