Figure 5.
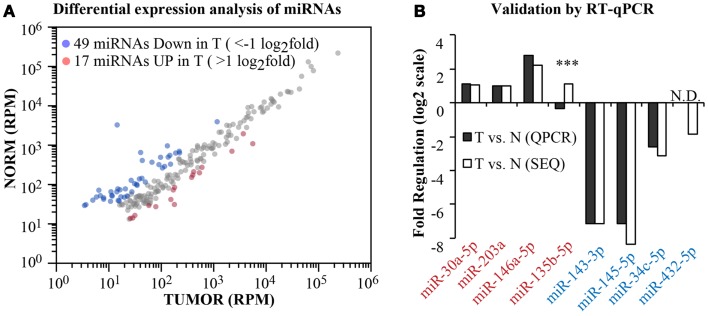
Differential expression analysis. (A) A scatter plot shows the expression level of canonical miRNAs in the normal and tumor samples. Data have been normalized in reads-per-million (RPM) and shown in log10 scale. Blue and red dots identify those miRNAs with >1 log2 fold regulation between the two samples. (B) Comparison of the fold change as measured by RNA-seq or by RT-qPCR (miScript assay, Qiagen) for eight randomly selected miRNAs (four upregulated and four downregulated). Three asterisks mark non-concordant results. N.D., no PCR data.

